

Listen to the audio version of this article (generated by AI).
Editor’s Note: Oil markets can’t seem to catch a break as geopolitical tensions, supply concerns, and global uncertainty continue to build, welcoming serious volatility.
To explain how to navigate periods like this, I’ve invited my colleague Jonathan Rose to discuss the two specific market signals investors should watch out for — and why he believes they may already be pointing toward another major opportunity in oil and refinery stocks.
Jonathan has spent decades trading volatile markets, from the futures pits in Chicago to the options floor at the CBOE. Now, he’s teaming up with Wall Street veteran Marc Chaikin for a special event on May 28 at 8 p.m. Eastern to discuss their new “Convergence” system designed to track institutional money flow and volatility together.
You can reserve your free seat right here.
Take it away, Jonathan…
In October 1973, the world learned just how fragile the global oil order really was.
A coalition of Arab states attacked Israel on Yom Kippur. The U.S. responded by sending aid. And within days, OPEC issued an oil embargo against the United States.
The result was immediate and brutal. Oil went from $2.90 a barrel to $11.65 in three months. At the pump, Americans watched prices jump 36% practically overnight. Drivers sat in gas lines for hours, and some stations ran dry before noon. Rationing kicked in.
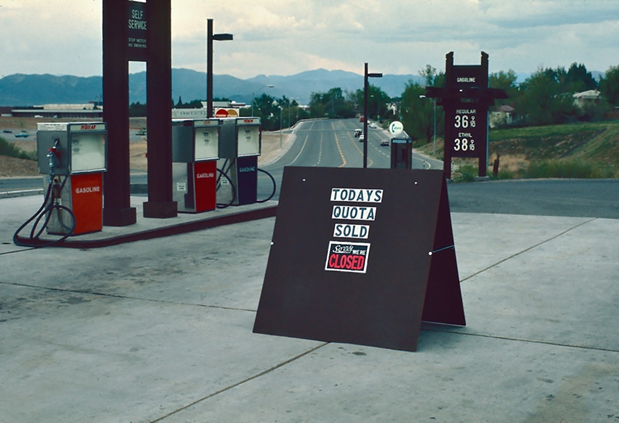
Credit: JudiLen
Americans watched gas prices explode almost overnight while Washington imposed a national speed limit of 55 miles per hour and urged citizens to conserve fuel as a patriotic duty.
The shock eventually eased. But before the decade was out, the Iranian Revolution triggered a second supply disruption that sent prices even higher. By 1981, oil had hit $35 a barrel — nearly 12 times what it cost before the OPEC embargo.
What those two crises revealed wasn’t just how much the world ran on oil. They also revealed how fast the entire system could crack when the geopolitical order shifted underneath it.
Fifty years later, it’s shifting again.
And this time, the cracks are deeper.
In this piece, I want to give you something more useful than a prediction.
I want to show you exactly how I read an oil market under stress — the two specific signals I watch, how they work together, and how they already handed us one of our best trades of the year.
If you understand these signals, you’ll never look at an oil headline the same way again. And you’ll know what to do with your money – and make a profit – before Wall Street figures it out.
This Could Be Bigger Than 1973
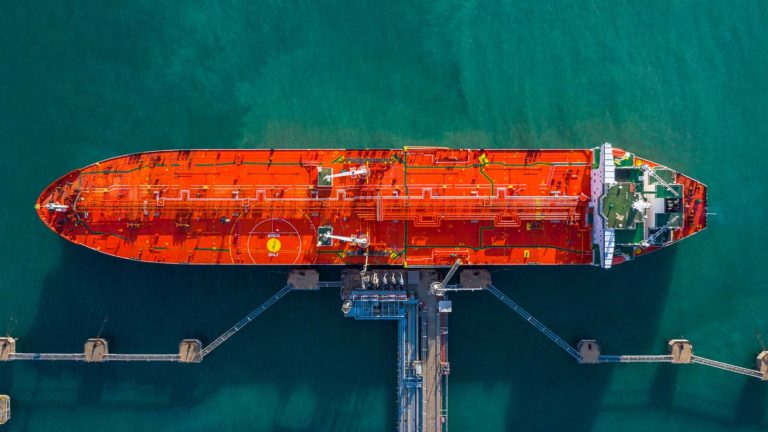
Earlier this year, the U.S. entered a conflict with Iran that put a lockdown on the Strait of Hormuz – the narrow waterway through which roughly 20% of the world’s oil supply passes every single day.
When it’s under pressure, we all feel it.
Oil responded immediately. West Texas Intermediate crude ran from $66 a barrel to over $100. Brent — the global benchmark — climbed from $71 to $119. In three months, crude prices nearly doubled.
But the bigger story wasn’t the price move. It was what happened inside OPEC.
After nearly 60 years, the United Arab Emirates announced it was leaving the cartel.
This is not a minor development.
The UAE is one of the world’s top five oil producers. Its exit isn’t a diplomatic footnote — it’s a fracture in the architecture that has governed global oil supply since 1960.
The timing made it worse. The announcement came right before a scheduled OPEC meeting, in the middle of an active regional conflict, with the Strait of Hormuz already under pressure.
In 1973, the crisis came from outside OPEC — Arab states using oil as a weapon against the West. What we’re watching now is that alliance coming apart. That instability may end up being deeper and harder to reverse than in 1973.
The question isn’t whether energy market volatility will stay elevated. It will.
The question is how to position yourself to profit from the volatility that is becoming a long-term feature of the energy markets.
That starts with understanding two signals.
The Two Signals I Watch When Oil Gets Volatile
I’ve been trading energy markets for nearly 30 years — from the futures pits in Chicago to the options floor at the CBOE. And in all that time, I’ve found that the most reliable way to profit from oil volatility isn’t to predict where prices are going. It’s to read what the market is already telling you.
Two signals do most of that work. These aren’t predictions. They’re instruments that help the pros profit.
The first is the crack spread. That’s basically the profit margin for oil refiners. Think of it like owning a bakery. Your input cost is flour — that’s crude oil. Your output is bread — that’s gasoline and diesel. The spread is the difference between what you paid for the ingredients and what you sold the finished product for. That difference is your profit margin.
When the crack spread expands — meaning refiners are making more money per barrel they process — refiner stocks tend to follow. When it compresses, they struggle.
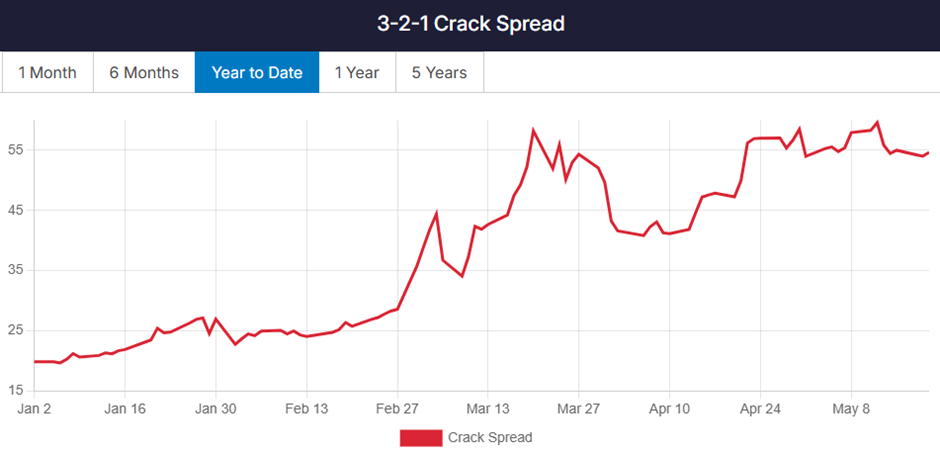
Right now, the crack spread is expanding. Refiners bought crude weeks ago at lower prices. They’re selling gasoline and diesel today at prices implied by $106 crude. That gap — old crude, new prices — is pure margin. And it’s showing up directly in refiner earnings.
That’s Signal 1.
The second signal is backwardation in the futures. This one sounds technical. It isn’t. Here’s all you need to know.
When the oil futures curve is in backwardation, it means near-term contracts are trading above longer-dated ones. In plain English, buyers are paying a premium to get oil now rather than later. That tells you immediately that the market believes supply is too tight to absorb a shock.
That’s exactly what the WTI futures is showing us today. Front-month contracts have surged as refiners, hedgers, and institutions pay up for prompt delivery. Contracts further out into late 2026 flatten considerably.
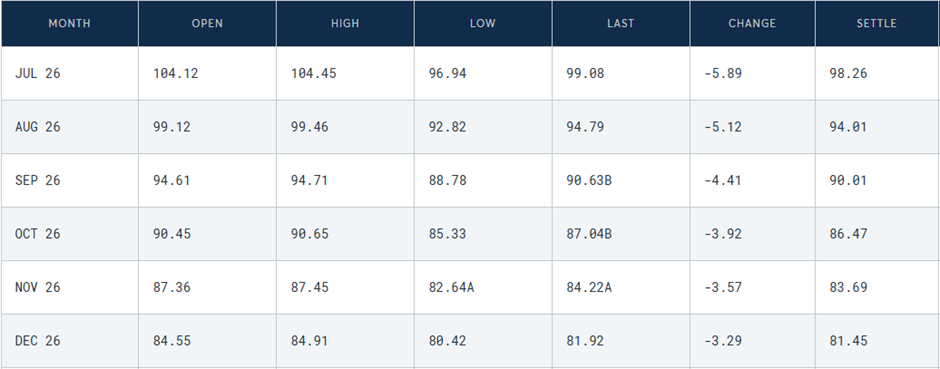
In short, the market sees near-term supply strain but expects conditions to ease over time.
That distinction matters because it tells us where capital is flowing right now — into assets tied to near-term scarcity and pricing power. Refiners. Select producers. Names with direct exposure to U.S. domestic supply chains.
When the crack spread is expanding and the futures curve is in backwardation at the same time, the market is sending a clear two-part message: refiners are making serious money right now, and institutional energy traders are paying a premium to secure supply immediately.
That combination — margin expansion plus supply urgency — is historically when refiner stocks and energy names make their biggest moves to the upside.
It’s the setup for a bullish trade on oil and refiner stocks.
Here’s how that trade looked in practice earlier this year.
The Trade That Proves the Signals Work
Back in April, both signals fired at the same time.
The crack spread was expanding. The WTI futures curve was moving into backwardation. And one name kept showing up on my radar: CVR Energy Inc. (CVI). It’s a midsized independent refiner with direct exposure to exactly the kind of margin environment the signals were pointing to.
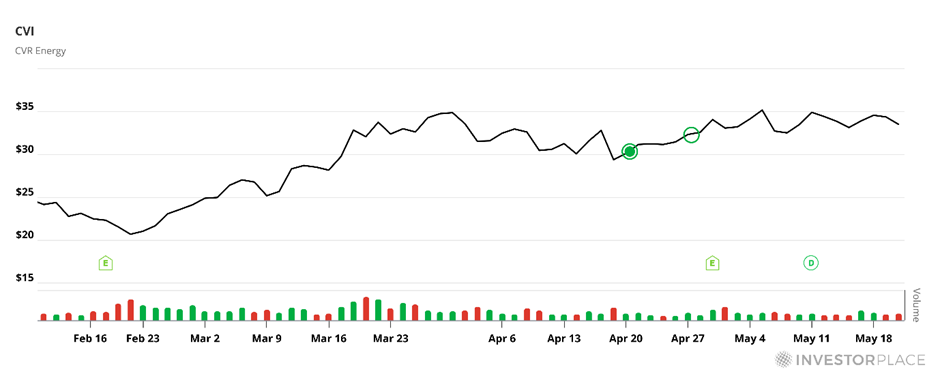
On April 20, I got my members into a bullish position on CVR at the beginning of the month. The setup was clean. The signals were clear. The risk was defined.
In just a single week, we locked in an 80% return on the lagging refiner.
That’s not luck. That’s what happens when you stop trying to predict where oil is going and start reading what the market is already telling you. The crack spread said refiners were making serious money. Backwardation said supply was too tight to absorb a shock. CVR was the most direct way to express that opinion with defined risk.
Catalyst. Signal. Trade. That’s the whole model.
And right now, both signals are firing again.
The crack spread is expanding faster than it has in months. The WTI futures curve is deep in backwardation. The UAE’s exit from OPEC has added a layer of structural uncertainty that isn’t going away quickly. And the Strait of Hormuz remains under pressure.
The setup that handed us CVR is back. The names that benefit most from this environment are the same ones I’ve been watching since the conflict began — refiners, select producers, and companies with direct exposure to U.S. domestic supply chains.
The question now isn’t whether the opportunity is there. It’s whether you have the tools to find it before Wall Street does.
What I’m Doing About It — and How You Can Too
Here’s something I tell my members all the time: Know what you’re good at… and know where you need help.
I’m good at reading volatility. Finding the setup. Identifying the signal before the crowd sees it. What’s harder — for every floor trader I’ve ever known — and for me is direction. Not whether volatility is coming. But whether the next big move breaks up or breaks down.
That’s where Marc Chaikin comes in. Marc spent decades building the quantitative tools Wall Street’s biggest institutions use to forecast market direction. He designed his Money Flow system to answer a different question than mine. I focus on where volatility is building. Marc focuses on whether institutional money flow confirms the direction.
My expertise is finding where volatility creates opportunity.
Marc’s expertise is in knowing which way it breaks.
Together, we’ve built something that combines both. We’re calling it The Convergence, and on May 28 at 8 p.m. Eastern, we’re going live with it for the first time. (You can reserve a seat for that free event right now.)
The global oil order is cracking. The two signals I’ve shown you today are already firing simultaneously. And the window to position before Wall Street catches up is, as always, shorter than it looks.
This event is free. And it’s the first time we’re combining these two systems in front of an audience.
Reserve your spot right here. Don’t miss it.
The creative trader always wins,
Jonathan Rose
Founder, Masters in Trading
P.S. Jonathan makes an important point in today’s piece: Major market moves often begin long before the headlines fully explain them. That’s a big part of what he and Marc Chaikin plan to discuss during their free Convergence Summit event on May 28. They’ll explain how they combine volatility analysis with institutional money-flow signals to spot potential opportunities early. If you haven’t already reserved your seat, you can do that right here.