International Business Machines Corp. (IBM) is broadcasting a troublesome message. It’s written in the charts for all trained observers, and the outlook for IBM stock is best summed up with a simple three-word phrase:
More pain ahead.
But let’s not get ahead of ourselves. Before obsessing over what’s next for the beleaguered tech giant, let’s study past IBM stock charts to see if there are any clues to be had.
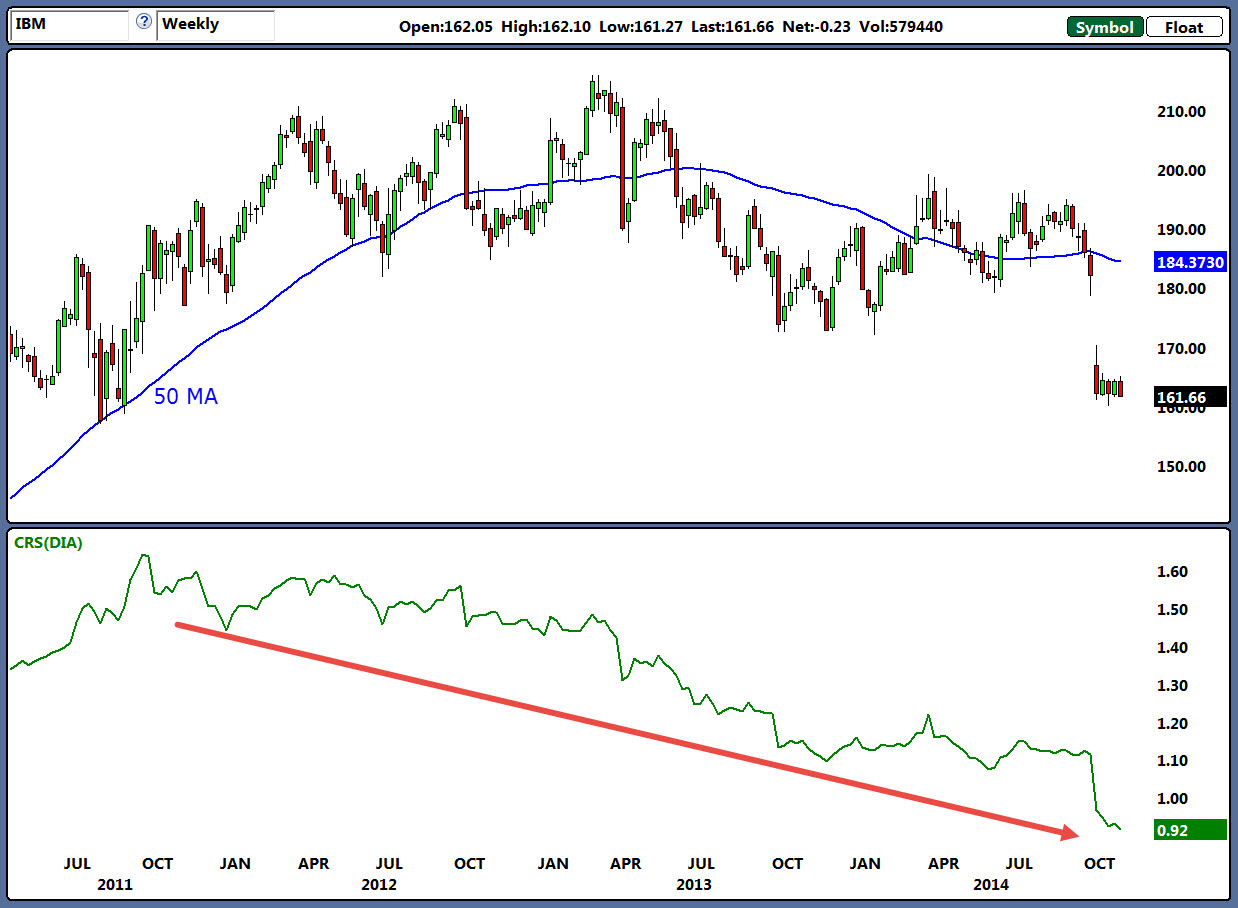
IBM has been a serial underperformer, a perpetual disappointment for shareholders of all stripes. Their pleas have been ignored, their prods ineffective. And IBM’s inability to keep up with the performance of the Dow Jones Industrial Average is now going into its fourth year.
The chronic weakness that began in the fall of 2011 is easily seen in the comparative relative strength study of the accompanying chart.
Click to Enlarge
Sadly, a brief survey of this year’s performance reveals that the underperformance is accelerating. Year-to-date, the Dow is up 6.4% while IBM stock is down 13.8%. Currently, IBM sits in dead last as the worst performer of all Dow 30 stocks this year.
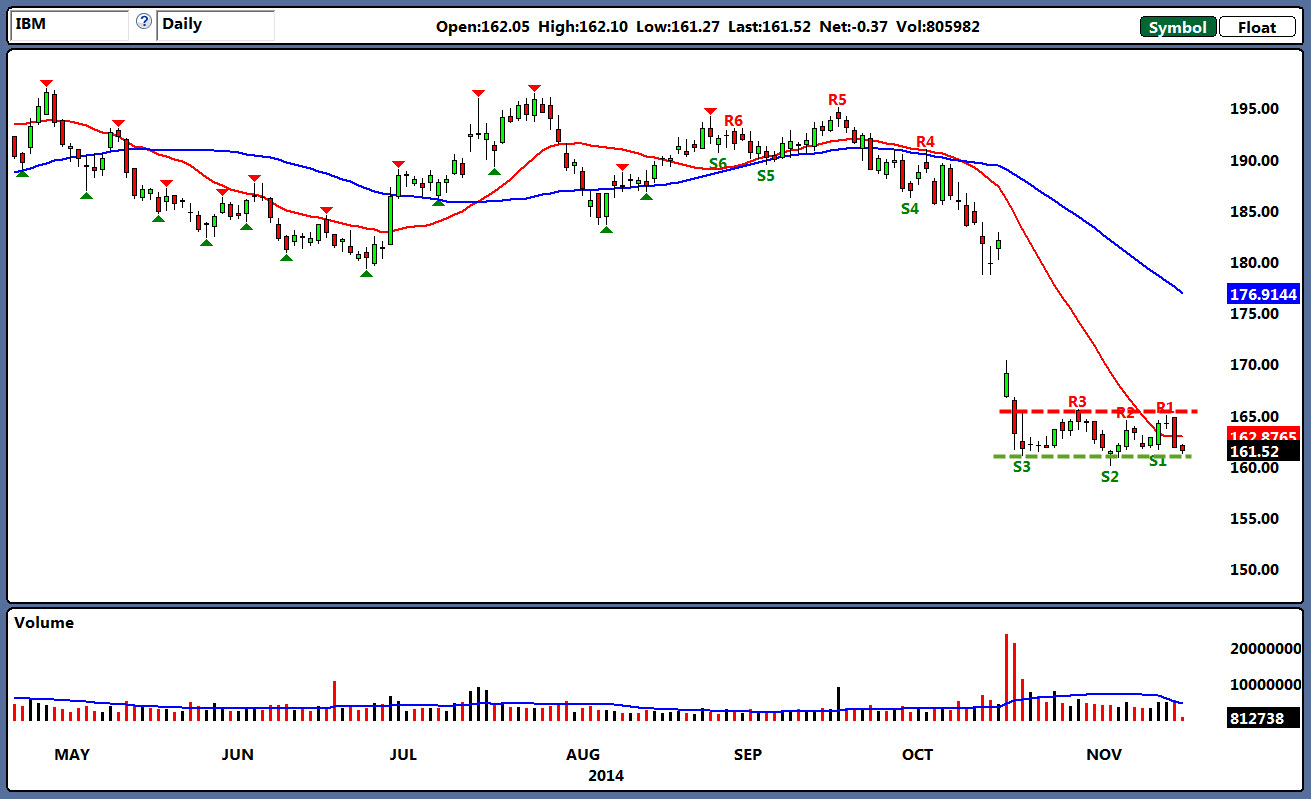
Since it’s mega-down gap following October’s disappointing earnings announcement, IBM stock has been flat. It’s as if the impotent bulls lack the vigor to reclaim lost ground, while the exhausted bears need time to rest before their next onslaught. I suspect the current stalemate ends soon. Look for a break below the $161 support zone for confirmation that the next move down in IBM is beginning.
Click to Enlarge
Play IBM With a Put Spread
To profit from the coming drop consider buying the Jan $160-$155 put spread for $1.50. The max risk is limited to the initial $1.50 debit and will be lost if IBM remains above $160 at Jan expiration.
The max reward is limited to the distance between strike prices minus the net debit, or $3.50, and will be captured if IBM can fall below $155.
As of this writing, Tyler Craig did not hold a position in any of the aforementioned securities.