The rally in the Materials and Retail sectors continues to gain strength as we head into the year-end.

 This morning, an acquisition and analyst upgrade have our eyes on the charts of Mosaic Co (NYSE:MOS) and Costco Wholesale Corporation (NASDAQ:COST) as they appear ready to rally higher. Similarly, Intel Corporation’s (NASDAQ:INTC) chart has made a move that has put it on technical traders’ radar screen to round out our Three Big Stock Charts for Monday.
Mosaic Co (MOS)
Mosaic announced this morning that the company was purchasing Vale Fertilizantes for $2.5 billion. The move will open the growing Brazilian market to Mosaic and expected to be accretive to the company’s balance sheet by 2018.
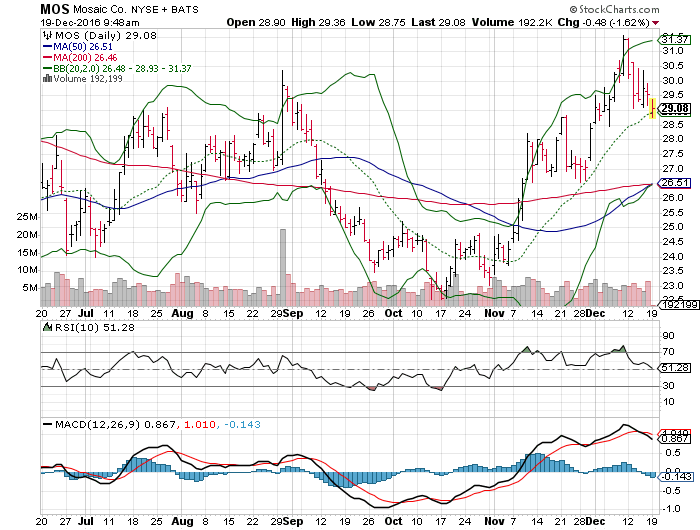
Putting the possibility that the fundamental news is bullish for Mosaic, the technicals continue to show support and strength for the stocks.
Along with the other materials companies, Mosaic shares have seen a pullback over the last two weeks. Mosaic’s pullback has come to the tune of 7% downside from its highs, putting shares in position for the short-term traders to grab them before the next rally.
Chart support is extremely clear at the $30 price for mosaic. This is the site of round-numbered chart support, along with the short-term 20-day moving average. In addition, there is a development in the intermediate-term trendlines that lends itself to a positive outlook.
The 50- and 200-day moving averages are on approach to form a Golden Cross pattern within the next week or so as the 50-day crosses above the longer 200-day trendline. Historically, this is a bullish signal for the intermediate-term outlook for a stock.
From here, support at $30 should lend itself to a break above $31 and an intermediate-term price target of $33.
Costco Wholesale Corporation (COST)
Grabbing an upgrade today are shares of Costco, as the growing economy and steady inflation has analysts looking at the shares favorably. This follows an earnings move two weeks ago that broke the shares higher after consolidating at $150.
The break also pushed shares of Costco above a confluence of technical trendlines at the $155 price. Currently, Costco’s 20-, 100- and 200-day moving averages are converging on the $155 price with the 50-day now in an ascending pattern heading towards the same level.
This group of trendlines will provide strong support for the stock at the $155 level in the case of some selling pressure from the short-term overbought signal. Overall, the stock should continue to gain strength from this trend and begin to eye a price target of $168 which is the high from this summer.
Costco is benefitting from some short covering on the recent move as we’re seeing short invest decline, though not from the extremely high levels that were set in June and July just ahead of the stock’s 10% rally. Nonetheless, we should expect to see short covering help the stock higher, not to mention the potential for other analyst upgrades given the improvements in the fundamental picture.
Intel Corporation (INTC)
Technology stocks continue to lag the market as the post-election sector migration continues to favor infrastructure, transportation and other companies that are likely to factor into the proposed “rebuilding” that is to take place over the next few years.
While Intel is among the companies that could get dragged down in the general lack of enthusiasm to technology, our charts are telling us that there is still an intermediate-term opportunity for the shares to perform.
Like Costco, Intel shares just hurdled a group of technical trendlines that are transitioning into bullish patterns. Last week, Intel shares completed the cross above their 50- and 100-day moving averages, which are tangled together at the $35.50 price level along with the faster 20-day moving average.
The cross above these trendlines now fortifies the $35 level as support and opens-up a move above $38 (our short-term target) and higher.
Short sellers have been increasing their bearish bets on Intel as we head into the end of the year, which is the same activity that we saw last year. A short squeeze could get triggered on the recent strength, which would help to drive the shares towards our short-term price target at $38 or higher.
As of this writing, Johnson Research Group did not hold a position in any of the aforementioned securities.