The market continues to do its best bird on a wire imitation as it hands on to trading at the top of the range. As we’ve mentioned, the trading range environment is splitting traders between the bull and bear camps, putting a little more uncertainty in the market’s next move. That said, the charts of Dean Foods Co (NYSE:DF), Bank of America Corp (NYSE:BAC) and J C Penney Company Inc (NYSE:JCP) are sending actionable directional signals to traders that are worth looking at.
Dean Foods Co (DF)
Click to Enlarge
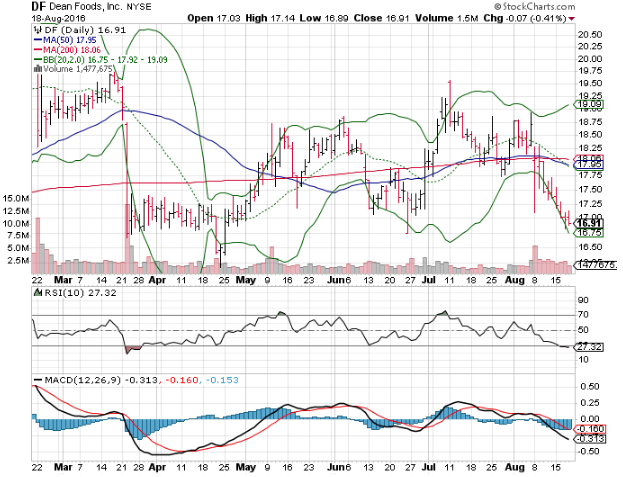
Food companies like Dean Foods have been strong performers through the year, but recently we’ve seen some weakness that is leading to a potential trading opportunity.
Dean Foods stock had been trading in the middle of its range in August, until its earnings results knocked the stock down to the bottom of a range that the shares have been locked in for more than a year. The bottom of the range has been $16, with some trading activity taking DF stock below this price, but it has always mustered the strength to get above this lower boundary.
Yesterday’s trading pierced the $17 point, and pushed Dean Foods shares into technically oversold territory at the same time. The combination of these two technical developments should help to give some rally potential to DF stock.
Oversold signals on range-bound stocks tend to carry more weight, as the signals themselves can often be responsible for drawing the range. This appears to be the case with Dean Foods. Looking back on similar signals over the last four signals, the shares have seen bulls come in to power the stock higher.
Given support at $17 holds, watch for DF to target a move back to the $20 level with some resistance at $18.25.
Bank of America Corp (BAC)
Click to Enlarge
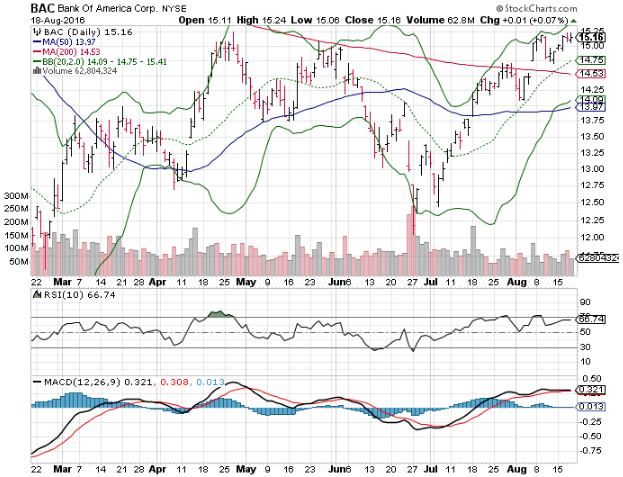
Financial stocks have been trying to improve their technical picture, especially as investors and traders alike await a move to raise interest rates by the Federal Reserve. Bank of America recently cleared a number of technical trend hurdles that are opening more upside potential for BAC stock.
The short- and intermediate-term charts for Bank of America are growing more attractive as they have successfully cleared their 20-, 50- and 200-day moving averages. The growing technical strength is confirmed by the 50-day moving average moving into an ascending trend itself, which doubles the likelihood that BAC stock will trade higher each day according to our quantified studies.
A long-term technical test is underway right now as Bank of America stock is trying to post its first monthly close above its 20-month moving average. This trendline is considered the line of demarcation between a bull and bear market for a stock. This would be the first close above this trendline since December and would officially put BAC in a bull market.
On a slight warning, BAC stock has been trading dangerously close to technically overbought conditions, which could see the stock make a slight pullback, but we would see this as a buying opportunity to grab the shares ahead of their next bull run that would have an initial target of $18.
J C Penney Company Inc (JCP)

Click to Enlarge
J C Penny has been all over trader’s radars for the last few weeks as the stock has surged beyond its peers by rallying more than 30% ahead of and after its latest earnings report. After that strong move, JCP shares have been taking a well-earnings rest as traders have locked-in profits. The profit-taking has shaved 8% from J C Penny shares, but it’s also setting-up another chance for traders to go long again.
J C Penny shares have strong chart support at the $10 level, as this price has acted as strong resistance in the past.
Given that shares have transitioned into an intermediate-term bull, this resistance is now likely to turn into support. In addition, we’ve mentioned stocks’ natural tendency to use round numbers as support and resistance, this increases when there are zeros after the numbers (think Dow 10,000).
Momentum indicators on JCP are suggesting that while the recent rally may have overextended itself, the shares are truly set to maintain their course higher. According to our breakdown of the historical activity, the current momentum is likely to target the $12 level.
For now, shares will continue to work-off the overbought conditions and may see selling press them below the $10 mark with even more support potentially growing below that price. Worst case is that JCP stock moves down to stronger support from its 50-day moving average, which is trading at $9. This would provide an opportunity for traders to dollar cost average into positions that opened at $10, with the target of $12 still remaining on the upside.