The price of gold, as measured by the popular SPDR Gold ETF (NYSEARCA:GLD), is currently higher by about 5% for the year. While this may not excite the quick money chasers, the underlying up-trend looks to just be getting started. Thus, the GLD ETF looks like a good tactical allocation through the coming months and quarters.

When looking at a sector or group or stocks, or an entirely different asset class like a commodity or parts of fixed income it is imperative to understand what the underlying driver is for price movement. Just like each stock sector, the price of each commodity has its own unique set of “things” it reacts most sensitively to and certain market environments that it either likes or dislikes.
Regarding the price of gold, over the course of my career as a professional trader and investor, I have found that the environment it likes most is when both economic growth as well as inflation expectations are dropping. This happens to be the broader economic environment we currently find ourselves in.
GLD ETF Charts
Click to Enlarge
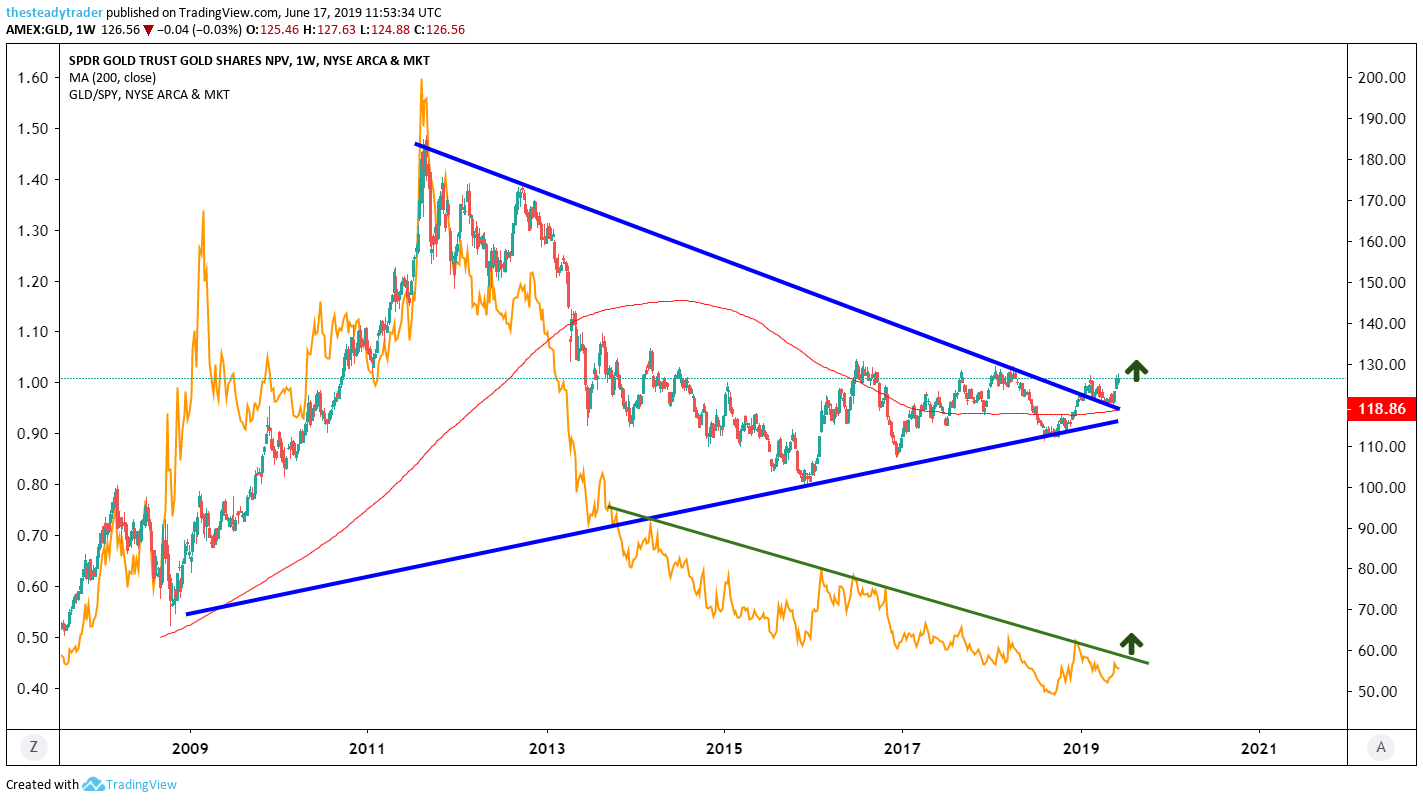
Moving on to the charts, it is particularly important when making bets on the price of gold to have the proper perspective as to where it currently trades in the bigger picture.
On the multi-year weekly chart we clearly see that the GLD ETF recently broke out of a well-defined narrowing wedge pattern (blue lines). From this perspective, this absolute price breakout looks to have plenty of room left on the upside toward $140 as the next bigger target for now.
In the lower part of the chart in yellow, I plotted a ratio chart of gold divided by the S&P 500. While the trend there is still lower, one can see that it won’t take much from here to see a relative trend break from bearish to bullish of gold versus large cap stocks. If and when we see a relative breakout come to fruition, this would only add fuel to the rally in the GLD ETF.

Click to Enlarge
On the daily chart, we see that thanks to the latest rally over the past few weeks, the GLD ETF has now arrived back at a simple horizontal area of technical resistance in the high $120s, as marked by the blue box. In this latest rally since late May, the ETF has rallied more than 5%. With the aforementioned overhead resistance in place this may well offer a cause for a pause in the rally in the immediate term.
However, note that this layer of overhead technical resistance is now being tested for the seventh time since September 2017 and it also offered resistance in 2016. In my eye, the more often this technical layer is pierced, the better the odds that ultimately the price resolves higher.
Thus, investors and traders with a time horizon of a few months/quarters could look to buy the GLD ETF here in the mid-to-high $120’s with a next upside profit target at $140 and a stop loss at $120.
Get FREE ACCESS to Serge’s renowned Stock Market Scanner with actionable trade ideas. Get it HERE.