Is General Electric (NYSE:GE) finally in position to bring good things to life for shareholders or simply a lights out situation? Let’s take a look at what’s happening off and on the GE stock chart to make a better determination for investors in the weeks and months ahead.

Shares of turnaround play General Electric have made a turn for the worse in recent weeks. The once-mighty industrial and former DJ-30 mainstay were hard hit in May.
Shares finished down 3.38% and in stark contrast to the bellwether index’s own gain of 4.55%. What’s more, the relative weakness put GE at fresh ten year lows and worst levels since the 2008 – 2009 financial crisis.
So, what gives? Most will agreeably point to the aerospace industry. It’s no secret the area has been devastated by the novel coronavirus. Air traffic was off as much as 90% at its worst during the pandemic.
And bottom-line, General Electric’s aviation business which supplies and services aircraft engines for customers like Boeing (NYSE:BA), has been a casualty.
As part of the fallout this past week GE’s CEO warned the unit’s weakness, despite cost-cutting of $2 billion and $3 billion in cash conservation over the course of the pandemic is negatively impacting the company. Moreover, the company confessed General Electric’s cash burn rate could be twice that of the first quarter and in the red by $3.5 billion to possibly $4.5 billion.
But while investors did heed the news, was the bearish sounding pronouncement already priced in?
Possibly. A sneak preview was in fact delivered at the end of April as GE released its Q1 results. At the time management warned of a ‘more challenging’ second quarter due to Covid-19.
Also a positive, GE’s update could have ushered in cuts from Wall Street’s sell-side. That hasn’t happened though. In fact, UBS reiterated its above-the-market $7.50 price target noting the update confirms the company’s turnaround story remains intact.
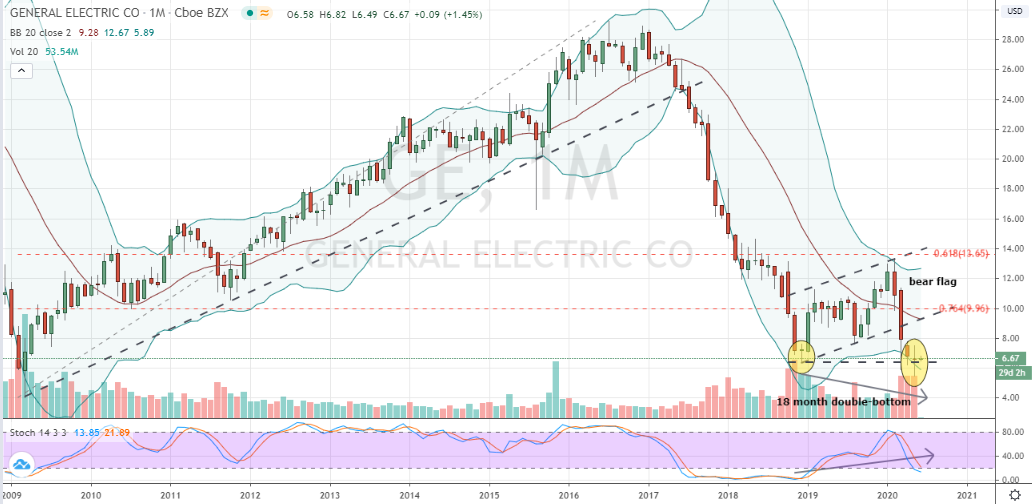
GE Stock Price Monthly Chart
Click to Enlarge
Last week also brought news General Electric had sold its iconic lighting business to privately-held IoT outfit Savant Systems.
The announcement wasn’t entirely surprising as the under-performing consumer unit isn’t aligned with the company’s core strategy.
Ironically, an obviously under distress price chart also hints that shares of GE may not be the ‘lights out’ situation others could be fearing.
Technically, the monthly chart of GE reveals a stock that’s failed all key Fibonacci support levels formed since its 2009 bottom while also breaking beneath a bearish flag pattern.
The price action puts shares at risk of a full-fledged challenge of that historic low. It’s concerning, but there is good news that’s also importantly taking shape on the price chart right now.
Bullishly, GE could be gearing up to form a meaningful higher-low monthly pivot relative to its 2009 low. Supportive of this forecast, shares have formed a double-bottom over the last 18 months. Backing this idea up, stochastics is showing a bit of bullish divergence as the indicator begins to flatten near oversold levels.
The Bottom Line on GE
My advice for today is to watch for General Electric to overtake May’s doji high of $7.49 before considering a purchase. That’s also contingent on the double-bottom pattern continuing to hold.
For stock traders taking initial profits at $10 relative to a stop-loss beneath the December 2018 pattern low of $6.36 looks good. But in our experience, an even ‘brighter idea’ is to consider hedging GE shares with an intermediate collar instead.
Disclosure: Investment accounts under Christopher Tyler’s management do not currently own positions in any securities mentioned in this article. The information offered is based upon Christopher Tyler’s observations and strictly intended for educational purposes only; the use of which is the responsibility of the individual. For additional options-based strategies, related musings or to ask a question, you can find and follow Chris on Twitter @Options_CAT and StockTwits.