Wrapping up a surprisingly strong earnings season … a special prediction with Louis Navellier and Whitney Tilson … is the S&P about to enter a “Stage-2 breakout”? … why Luke Lango is bullish
We’re wrapping up an earnings season that ended up miles better than analysts had forecasted.Earnings were down – “bad” on an absolute basis – but their better-than-expected performance surprised the market – so, “good” on a relative basis.While absolute earnings drive a stock’s long-term performance, earnings surprises are what push around prices in the short-term. So, given the positive relative surprise, the S&P has not only survived this earnings season, it’s up about 2% since it began.Let’s jump to FactSet, which is the go-to earnings data analytics group used by the pros. From their Earnings Insight report last Friday:
At this late stage of the Q1 2023 earnings season, S&P 500 companies are recording their best performance relative to analyst expectations since Q4 2021.Both the number of companies reporting positive EPS surprises and the magnitude of these earnings surprises are above their 10-year averages.The index is reporting higher earnings for the first quarter relative to the end of the quarter. However, the index is still reporting a year-over-year decline in earnings for the second straight quarter.Overall, 95% of the companies in the S&P 500 have reported actual results for Q1 2023 to date. Of these companies, 78% have reported actual EPS above estimates, which is above the 5-year average of 77% and above the 10-year average of 73%.In aggregate, companies are reporting earnings that are 6.5% above estimates, which is below the 5-year average of 8.4% but above the 10-year average of 6.4%.
So, what can we say about this earnings season?
Legendary investor Louis Navellier sums it up best:
Earnings are working.In other words, companies that announced strong results were rewarded, and companies that revealed weak results were punished.
To illustrate his point, Louis highlights two Big Tech giants: Alphabet Inc. (GOOG) and Microsoft Corporation (MSFT).When Alphabet bested analysts’ expectations with its first-quarter earnings and sales, GOOG shares jumped as much as 8% in after-hours trading on the heels of its earnings report. While the shares did slip lower the next day, they bounced back and ended the week up 3.5%.Meanwhile, Microsoft reported 10% year-over-year earnings growth and 7% year-over-year revenue growth. MSFT shares rallied more than 7% following the quarterly results.The overall strong condition of earnings is just one more reason why Louis’ bullishness is growing today. But earnings aren’t the only reason.Louis sees another tailwind gaining strength. And today, he’s revealing what it is with the help of another market legend, Whitney Tilson.From Louis:
Whitney – an investment analyst friend – and I will be discussing this tailwind during today’s 2 Legends Predict 2023 event. It will transform how we work and live, improve our health, educate and entertain us and so much more.More importantly for investors, it is a game changer because this catalyst is going to profoundly disrupt the “knowledge economy” and all kinds of white-collar jobs.To access it, click here now.
Given Louis’ and Whitney’s collective track record of long-term market success, it’s absolutely worth hearing what they have to say.
Meanwhile, if we look at the S&P from a “stage analysis” perspective, the S&P is flirting with a Stage-2 break out
“Stage analysis” is the market approach behind Luke Lango’s trading service, Breakout Trader.Here’s Luke with the overview:
There’s always a bull market somewhere. You just have to find it.And the best way to find it is by performing something called “stage analysis.”Long story short, every stock at any given point in time is either going up, down, or sideways.To that end, every stock is always in one of four unique stages: 1) going sideways at a bottom, 2) going up, 3) going sideways at a top, or 4) going down.Stage analysis is the science behind figuring out which of these four stages a stock is in at any given point in time.
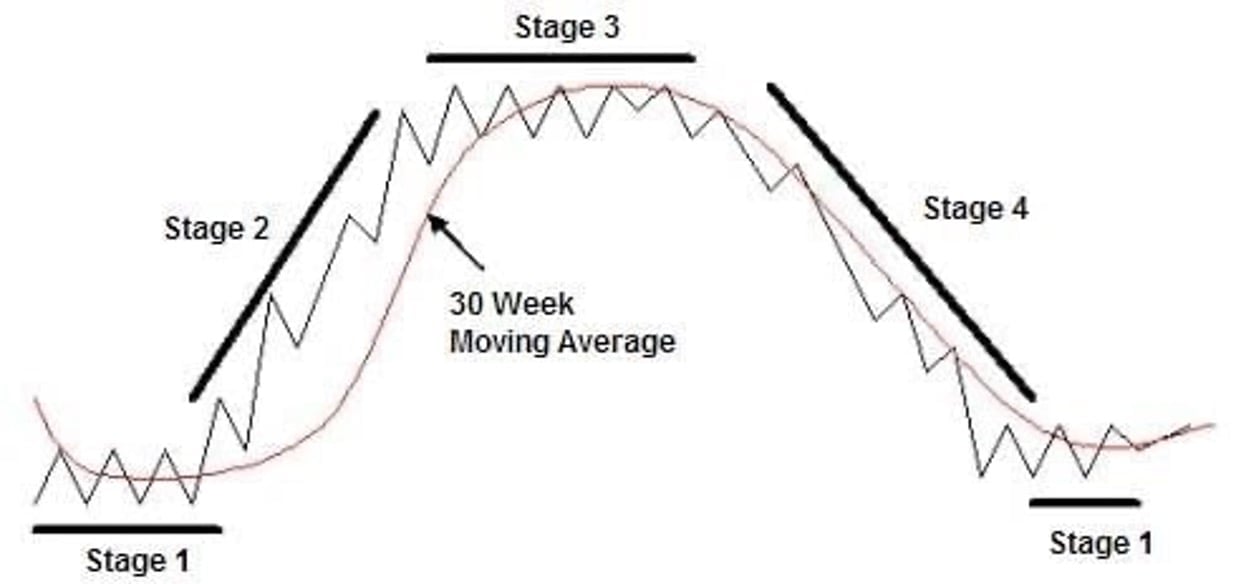
Obviously, the key to scoring consistently big returns in the market is to find stocks on the cusp of entering Stage 2 – or stocks that are about to break out.
If we look at the S&P today, there’s a strong case to be made that it’s on the verge of its own Stage-2 breakout.
Below, you can see the S&P falling in Stage 4 through much of last year (in red) before stabilizing and trading sideways in a Stage-1 consolidation pattern (in yellow).

There are a few things to note in this chart from a Stage-Analysis perspective.First, you can see the S&P’s recent price just now poking above the yellow, sideways Stage-1 channel line. This is significant…The level the S&P just broke was an area of support and resistance going all the way back to March of 2022 (the dotted part of the yellow line). We call this “horizontal resistance.” And it marks the top of the Stage-1 consolidation channel.If we can break above it – and stay above it, climbing higher on meaningful volume – that would suggest we’re officially entering a Stage-2 breakout, which would mean the potential for snowballing gains into the summer and fall.We would feel especially confident of such a breakout if we also can take out the S&P’s peak from August of 2022 at roughly 4,300.One reason to be optimistic about this happening is the series of “higher-highs” and “high-lows” from the S&P since last fall. Though we haven’t yet broken out to new, local high on the top side, you can see we’ve been climbing on the low side (in green, below).
Luke points out that this is an “ascending triangle.” It’s suggestive of a bullish breakout.Overall, here’s why Luke believes we’re headed higher over the coming months.From Breakout Trader:
We strongly believe the bias is for yields to move lower into July/August and for stocks to move meaningfully higher. The jobs reports over the next few months shouldn’t be awful, but they will likely show continued softening in the labor market and continued easing of wage inflation. That should have a net negative impact on yields. The inflation reports over the next few months will likely show more rapid disinflation than we’ve seen in the first half of the year. That should have a net negative impact on yields. And the Fed will certainly pause its rate-hike campaign by this summer and will maybe even start to discuss cuts, which will have a major net negative impact on yields. Therefore, the bulk of evidence suggests long-term Treasury yields will move meaningfully lower in the coming months. And that should translate into stocks moving meaningfully higher over that time, too.
Before we wrap up, a quick congratulations to Breakout Trader subscribers
Since the beginning of May, they’ve locked in gains on five winning trades. Here are the quick details:
- 40% gain in three weeks
- 25% gain in a month
- 35% gain in a month
- 30% gain in four months
- 70% gain in less than eight months
Again, congratulations to all you Breakout Trader subscribers.Keep in mind, these gains have accrued during a sideways Stage-1 market. If the S&P does enter a new Stage-2 breakout, the trading environment is likely to be even better for significant gains, while potentially in even shorter time-frames.We’ll keep you updated.Have a good evening,Jeff Remsburg