The long-awaited market pullback is here … how it looks through a stage analysis lens … is the correction nearly over? … Luke Lango’s latest take on where stocks go from here…
From the Digest two weeks ago:
The market needs a breather. Don’t be surprised when you see it, but don’t confuse it with the end of this bull run.
Well, we’ve been amidst that breather since August began. Yesterday appeared bullish after the morning’s cool CPI print, but that 1%+ rally fizzled in the afternoon. As I write Friday early-afternoon, stocks are mixed following this morning’s hotter than expected producer price index data.
So, where does that leave the S&P? How much additional weakness might be on the way before a return to bullishness?
To answer, let’s look at the S&P from a technical perspective. In doing this, we’re going to get help from our trading expert Luke Lango.
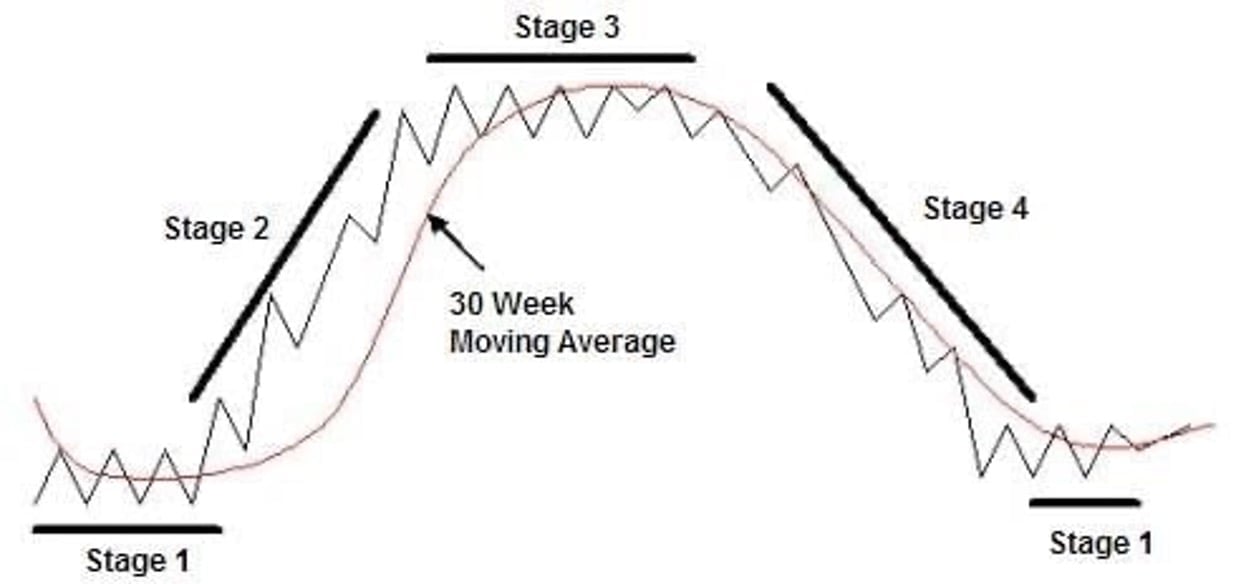
As regular Digest readers know, Luke approaches the market using a “stage analysis” framework in his trading services Breakout Trader and High Velocity Stocks.
In short, every stock at any given point in time is either going up, down, or sideways. Stage analysis is the science behind figuring out which of these four stages a stock is in at any given point in time, and then only investing in “Stage 2” stocks that are exploding higher on heavy volume.
Let’s begin by looking at the S&P with a big-picture stage analysis overlay.
As you can see below, the index has been in a Stage-2 breakout since the winter.

But let’s zero in on the Stage-2 breakout itself.
As you can see below, part of the reason why we were calling for the S&P to fall two weeks ago was because the bullishness had pushed the S&P’s price outside of its Stage-2 breakout channel.
Meanwhile, the S&P’s Relative Strength Index (RSI) had been poking in and out of overbought levels.
For newer Digest readers, the RSI is a momentum indicator that measures the extent to which an asset is overbought or oversold. A reading over 70 suggests an asset is “overbought” (with an elevated probability of pulling back) while a reading below 30 means it’s “oversold” (with an elevated chance of climbing).
Here’s a chart of the S&P from late-June through late-July (shortly before the market pullback) including its RSI that shows it reaching overbought conditions.
Based on what these charts were telling us, it appeared the S&P was due for a pullback.
Here was Luke’s take at the time, as well as what he predicted:
Things are a bit frothy in the market. So, I do think we’re due for a short-term pullback of some sort.
I think that if I had my best guess, that pullback would be about 3% – to 5% at the index level.
As it turns out, between August 1 and Friday as I write, the S&P is down 2.7%, coming in on the low end of Luke’s prediction.
So, what now?
Let’s do a bit more technical analysis then we’ll get Luke’s latest thoughts.
What stage analysis suggests for the S&P looking forward
In the wake of the market weakness, we now have an RSI indicator that has completely normalized.
As you can see below, it’s nowhere near overbought, coming in at 46.51 (50 is the RSI mid-level).
But this could be either bullish or bearish since the level of 50 can serve as either a springboard or a trap door.
Many times, you’ll see a stock’s RSI dip to 50, at which point buyers and algorithms will begin buying in droves, sending the stock sharply higher.
But if bullish spirits don’t buoy the stock, a fall through 50 can accelerate declines as those same traders and algorithms get out of the way until price finds support at a deeper level.
With the S&P’s RSI at 47 and dropping, the edge goes to short-term price weakness. If we don’t see a pivot to strength soon (hopefully later this afternoon), a falling RSI would likely prolong today’s soft market.
What about the S&P’s price itself? What does it suggest?
Well, let’s look again at the chart through our stage analysis lens.
As you can see below, if the correction is nearly over, it leaves the S&P trading high in its Stage-2 breakout channel. In fact, it’s barely beneath resistance.
This leaves the S&P vulnerable to another pullback in the weeks ahead.
That said, there’s another possibility at play that could be far more bullish.
Do we need to re-draw the S&P’s breakout channel more steeply?
Each week in his trading services, Luke provides subscribers with a video analysis that details each portfolio holding, analyzing it through this stage analysis lens.
Occasionally, you’ll see Luke re-draw his original Stage-2 breakout channel trendlines. This can happen when a stock’s price is so consistently bullish that it suggests the original channel lines were too conservative.
Are we seeing that happen with the S&P?
Below is how that might look.
The channel lines in green show us the Stage-2 breakout channel lines we’ve been following so far in this Digest. Our initial price anchor is the S&P’s low from last October.
We’ve added a new potential Stage-2 breakout channel in blue. This uses the March 2023 low as our anchor. The channel is also narrower, using only the price data since March.
Look how this changes everything.
If this new, steeper Stage-2 breakout channel is the correct one, then the S&P is now trading in the bottom half of its breakout channel. That means we would be much closer to support levels – and potentially, a return to bullishness.
The key level to watch here is roughly 4,400 (almost 2% lower than the market as I write). As you can see in the chart above, that’s the level at which the steeper Stage-2 breakout channel finds support.
If the S&P can hold and bounce there, we could see this market consolidation end sooner than later. If not, then watch for the S&P to fall farther into its original, less steep breakout channel.
Regardless of which scenario plays out, Luke says we need to be ready for more volatility in the coming days
Let’s jump to Luke’s Breakout Trader Trading Room video analysis from yesterday:
…In the short term, this is a stock market that needs more consolidation…
Whether this August selloff continues or not, turbulence and volatility will continue…
But soon enough, maybe in September, we will snap back into that bull market rally – because the fundamentals support and technicals support a strong bull market breakout.
Keep in mind, these pullbacks are nothing unusual. As we wrote in our July 31 Digest, though unlikely, the S&P could fall all the way to roughly 4,100 (about 8% lower) and still be in its original Stage-2 breakout.
We’ll keep you up to speed with Luke’s latest thoughts. In the meantime, keep your eyes on what the S&P does around that 4,400 level.
Have a good evening,
Jeff Remsburg