What’s behind today’s pricey S&P valuation … history suggests buying today isn’t wise … but is the market really as expensive as it seems? … why stocks are more attractive than at first glance
What if stocks aren’t that expensive?
What if they’re offering a 30% discount to the S&P’s average valuation over the last 30 years?
If you’re a regular Digest reader, this likely raises an eyebrow.
In recent months, we’ve looked at all sorts of valuation indicators suggesting that we’re in an expensive market. From the traditional price-to-earnings (P/E) ratio, to the forward P/E ratio, to the CAPE ratio, to the equity risk premium, and more… all the measures say “pricey.”
But with the help of Eric Fry, today, we’re going to argue against this takeaway.
And thanks to Eric’s analysis, we’ll detail how our current market is both expensive and inexpensive at the same time. Better still, you’re going to walk away from today’s Digest feeling far more confident about putting your money to work right now…and where you might want to take some profits.
The case for an “expensive” stock market
For newer Digest readers, Eric is our macro investing expert. He’s also probably the most successful investor you’ve never heard of.
In 2016, some of the world’s best money managers and stock pickers, including Eric, participated in an annual investing contest. Leon Cooperman, David Einhorn, Bill Ackman…
Eric beat them all. He won the contest, posting a one-year gain of 150%.
Beyond that, over his career, Eric has dug up 41 different 1,000%+ returning investments. Most investors never get one.
Returning to the topic of valuation, let’s begin with Eric’s take on why today’s market is expensive.
After detailing the S&P’s near-900% return since 2009, Eric points out the real reason for this fantastic performance – multiple expansion.
Here he is with the details:
[Multiple expansion] is the term Wall Street analysts use to describe the boost a stock receives when its valuation increases from low levels to higher levels.
Imagine, for example, that “Acme Technologies” is a $10 stock that produces $1 per share in annual earnings. At that price, Acme would be trading for 10 times earnings – also called a “price-to-earnings (PE) multiple of 10.”
Now let’s imagine that investors become so enthusiastic about Acme’s prospects that they bid its stock price up to $20 a share, even though the company’s annual earnings haven’t budged from $1.
In this circumstance, Acme’s PE multiple would have expanded from 10 to 20. That’s “multiple expansion.”
Eric goes on to note that U.S. valuations have been grinding higher for 15 long years. The resulting multiple expansion has been nothing short of breathtaking.
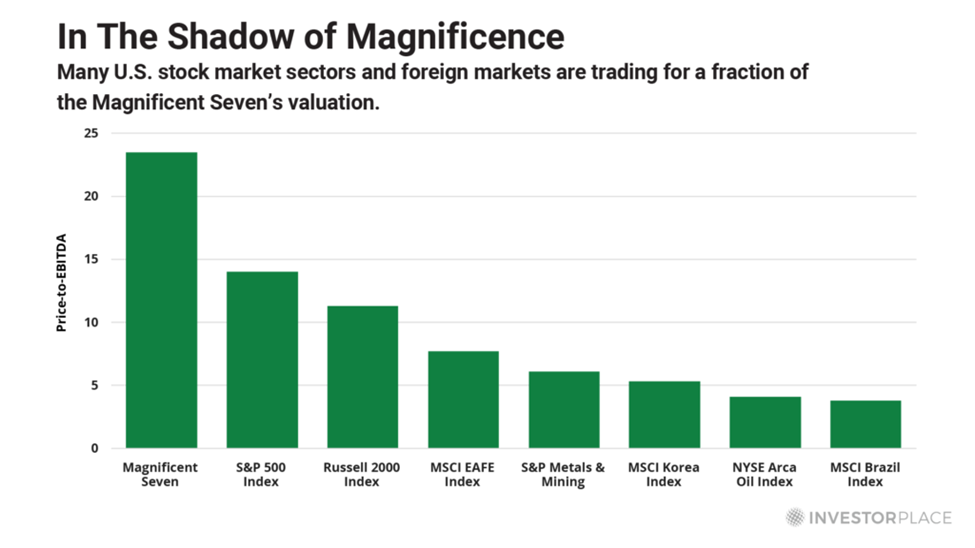
To illustrate, during the 2008-09 financial crisis, the S&P 500’s price-to-EBITDA ratio fell more than 50% below its long-term average. But today, the S&P trades 50% above this long-term average price-to-EBITDA ratio.
Here’s Eric’s takeaway:
In other words, U.S. stocks are pricey – both relative to their own history and to their foreign counterparts.
This premium pricing does not automatically mean that U.S. stocks are cruising for a bruising, but it does mean that risk is higher than average, based on historical precedent.
Why today’s price-to-earnings ratio suggests disappointing returns going forward
I promise you’ll feel better at the end of this Digest, but there’s more sobering news first.
Next, Eric makes the same point we often do here in the Digest: lofty valuations matter.
Historically, the higher a stock’s valuation at the time of purchase, the lower the ensuing multi-year returns.
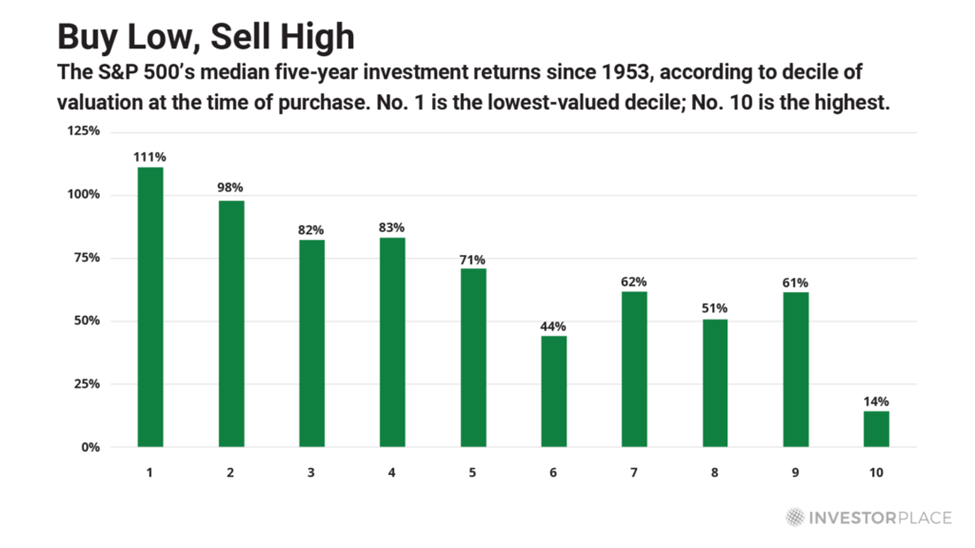
Eric illustrates this point using the traditional price-to-earnings ratio. With data dating to 1953, he analyzes the median five-year return that resulted from buying stocks at each decile of valuation.
First example, the first decile included the lowest 10% of month-end P/E ratios at the time of purchase while the last decile contained the highest 10% of month-end P/E ratios at the time of purchase.
Here’s Eric with his findings:
As you can see, the lower the P/E ratio at the time of purchase, the higher the following five-year returns tend to be. That’s why decile No. 1 has produced a median five-year return that is nearly eight times greater than what decile No. 10 has…
Based on the historical record, [the highest P/E ratio starting decile] delivers a median five-year return of 14% — or just 3.4% per year. Even more ominously, this decile produces a five-year loss 40% of the time.
By contrast, buying the S&P 500 below 15 times earnings has never produced a five-year loss during the last 70 years.
Not once.
So, with this context, what’s the S&P’s current P/E valuation, and in what decile does that place it?
It’s at about 22 times earnings which puts it in the highest percentile.
Not good.
The “wolf in sheep’s clothing” about today’s stock market
Yes, the S&P is pricey. And yes, that’s bad news for your forward returns.
But as we frequently write here in the Digest, the market is not one big monolith that rises and falls in unison. It’s made up of thousands of different stocks with varying fates and fortunes.
There’s a lot happening underneath the hood of “the market.” But today, that reality is more overlooked than ever for one big reason…
The Magnificent Seven stocks.
Back to Eric:
Five years ago, the Mag 7 stocks as a group were trading for 15 times gross earnings (EBITDA). Since then, their combined EBITDA has grown by 137%.
Therefore, if their valuations had not budged at all, their combined market value would also be 137% higher than it was five years ago.
But that’s not the case. Instead, their combined market value has skyrocketed by 270%, simply because their price-to-EBITDA valuation expanded from 15 to nearly 24.
In other words, the Mag 7 stocks would not be nearly as magnificent as they are today if their average valuations had not jumped 60%!
What the amazing performance of the Mag 7 stocks means for the S&P’s valuation
As regular Digest readers know, the S&P is a weight-averaged index. This means that each stock in the S&P is weighted according to its market cap. So, the bigger the stock, the greater that stock’s influence on how the S&P performs.
Today, the Magnificent Seven are responsible for just under 30% of the entire S&P.
Here’s the breakdown, showing the respective stock’s weighting of the index:
- Microsoft – 7.24%
- Apple – 6.40%
- Nvidia – 4.34%
- Amazon – 3.70%
- Meta – 2.50%
- Alphabet (both classes) – 3.79%
- Tesla – 1.24%
Clearly, their valuations have an enormous influence on the appearance of the broad S&P’s valuation.
Keyword “appearance.”
What if we strip-out the Mag 7 stocks from the S&P? What would that show about the underlying valuations of all the other stocks?
Back to Eric:
The price-to-EBITDA ratio of the other 493 stocks in the S&P 500 is only 6.5, which is identical to what it was five years ago… and is nearly 30% below the S&P 500’s average valuation of the last 30 years.
In other words, the average S&P 500 stock is not pricey at all, which means many precious, undervalued nuggets are hiding amongst the bright, shiny stocks that are captivating the attention of investors.
Therefore, rather than panic, I suggest making gradual reallocations from the priciest stocks to some of the least pricey ones.
Many great investment opportunities remain here in the U.S. market.
There are three ways to go with this information
This first is to focus on undervalued stocks here in the U.S.
Eric has been doing that by finding leading AI plays that don’t have today’s lofty valuations, yet do possess enormous earnings firepower as billions of dollars flow toward AI. You can learn more about that by clicking here.
The second way is to look outside of U.S. borders. This is another approach Eric is taking. In his latest issue of Investment Report, he highlights how the overall valuation of some foreign markets is considerably lower than that of the U.S.
About two weeks ago, we made the case for investing in emerging market (EM) stocks here in the Digest for this exact reason.
But instead of the traditional price-to-earnings ratio, we looked at the CAPE ratio (the traditional P/E ratio, but it uses 10 years’ worth of earnings data to smooth out business cycle fluctuation).
Here was our takeaway:
…Some EM markets are offering far more attractive valuations than U.S. stocks. So, moving some money into EM isn’t purely defensive – there’s an offensive firepower aspect too…
Today, the U.S. has a nosebleed CAPE ratio of 31.
Compare that to China at 9.6, Hong Kong at 11.4, or Brazil at 12.2.
If you’re an Investment Report subscriber, click here to read your latest issue in which Eric details how he’s recommending investing in foreign markets today.
The third way to go with this information is to consider selling down your Mag 7 stocks.
Yes, that might be painful in terms of taking some capital gains and dealing with the ensuing taxes, but holding all the Mag 7s today means you’re making a risky bet: These stocks will defy gravity over the coming quarters, climbing from nosebleed expensive to super-duper nosebleed expensive.
Perhaps you’ll be right, but that’s not a great risk/reward wager.
Stepping back, there’s no question that today’s market is expensive
But upon closer inspection, we find that it’s not uniformly expensive.
And the farther we move away from the Mag 7s, the more attractive and reasonable the average S&P stock valuation. Meanwhile, if we move significantly far away (as in other countries), many valuations become even more attractive.
So, nervous to invest today?
Don’t be.
But do pay attention to the specific price tag of what you’re buying, and what that suggests about coming returns.
Have a good evening,
Jeff Remsburg