Only a few stocks are driving this market … the average stock is meandering … will the election year save us? … why it’s time to look at small caps
Before we begin, a quick note…
Our InvestorPlace offices will be closed tomorrow in honor of Juneteenth. If you need assistance from our Customer Service team, they’ll be happy to help when we reopen on Thursday.
We hope you have a wonderful Juneteenth with friends and family!
The good news is that we’re in a strong bull market…the bad news is that you might be missing it
A handful of massive tech stocks are performing incredibly well. This provides the high-gloss appearance of a shiny bull market.
But under the surface, the average stock is struggling.
To illustrate this difference between appearance and reality, let’s start with Nvidia, the poster child for AI investing.
Year-to-date, this market darling is up 169%. This is extraordinary, especially coming off 2023’s blockbuster performance of a 239% gain.
But clearly, Nvidia is an outlier. So, as we try to get a bead on the market’s real performance, let’s gear down to a non-AI darling, but still a tech stock. Say, Netflix.
It’s up 40% so far this year. Another fantastic performance – but here again, it’s probably too great, likely providing a misrepresentation of the average tech stock return.
So, let’s zero in on the Nasdaq 100. This is a composite of the 100 largest non-financial companies on the Nasdaq. It’s up 18% in 2024.
This is the yardstick, right? This is what the average investor should be seeing in his/her portfolio?
Not unless your portfolio consists of a handful of top-performing tech stocks. If you’re more diversified, I suspect you’re nowhere close to 18% up.
Here’s why…
The indexes aren’t providing an accurate snapshot of the average stock performance
When we look at the Nasdaq 100 Equal Weight Index – which doesn’t allocate outsized weighting to the biggest mega-stock dominators including Nvidia, Microsoft, Broadcom, Amazon, Meta, Alphabet, etc. – then we get a completely different picture of how the average Nasdaq stock is doing.
As you can see below, while the Nasdaq 100 is up 18% this year, the Nasdaq 100 Equal Weight Index is up just 5%.

Last week, the Nasdaq hit a new all-time high – yet it did so with a whopping 72% of its stocks in the red, and twice as many stocks making new lows as those making new highs (below, the red shows new lows compared to green meaning new highs).
The situation is even worse over in the S&P
The S&P is up 15% this year, but the S&P Equal Weight Index (S&P EW) is up only 4%. I’ll show you that chart in a moment, but let me direct your attention to something ahead of time…
Notice what’s happened to the S&P versus the S&P EW since mid-May – one is climbing, the other is fizzling. I suspect you can take a guess at which is which…
This divergence is troubling.
Here’s one final bit of perspective about how narrow this market is from MarketWatch at the beginning of the month:
Nvidia’s stock is responsible for a third of the S&P 500’s gains this year.
Alphabet, Microsoft, Meta, Amazon together account for another quarter, according to UBS.
Bottom line: This is not how healthy bull markets behave.
What does history tell us about where the market goes in the wake of today’s dynamic?
Well, first, let’s define what we mean by “today’s dynamic.”
Last week, the S&P hit new all-time highs while simultaneously featuring:
- More NYSE issues hitting 52-week lows than highs.
- More NYSE issues declining rather than advancing.
- More NYSE volume flowing into losers than winners.
So, how has this dynamic played out in the past?
Here’s RIA Advice:
It has occurred four times, including today, since 1965.
In 1995, the market surged despite the warning.
It was again triggered multiple times in 1999, which was followed by a significant decline.
Similarly, the signal in late 2021 was followed by a moderate drawdown in 2022.
The new Sentimentrader signal could be a false alarm like in 1995. However, it might be a more immediate warning that the market is heading lower.
Here’s the chart illustrating the description above. The blue lines represent when we’ve had market conditions similar to today.
In short, except 1995, a moderate-to-severe market drawdown has eventually followed.
Could the presidential election help buoy the market against a drawdown?
As we’ve detailed here in the Digest, stocks tend to outperform during presidential election years.
If we are in danger of a market drawdown, might November’s election help defend this year’s gains against such an outcome?
If we go by history, it’s unlikely. That’s because we’re already tracking far above where we usually are at this time in an election year.
In fact, as you can see below, if 2024 ends up posting its average election year return, it means we’re headed lower.
Below, “all election years” is in red and “average performance since 1964” is in purple.
As you’ll see, their full-year returns are well-below 2024’s year-to-date return in aqua.
So, what do we do with this?
Well, we’ll begin with a refrain we often repeat here in the Digest:
Remember that it’s not so much a stock market as it is a market of stocks.
In other words, the market is not one huge monolith that rises and falls in unison. It’s made up of thousands of different stocks that perform well and poorly at different times, for different reasons, and in different market environments.
Now, while we would usually pivot to a handful of specific stocks that we believe are likely to outperform in this environment, today, let’s go another route…
Let’s put the entire small-cap universe on your radar.
If you’ve been in small caps for a while, you’re probably feeling nauseous all of a sudden
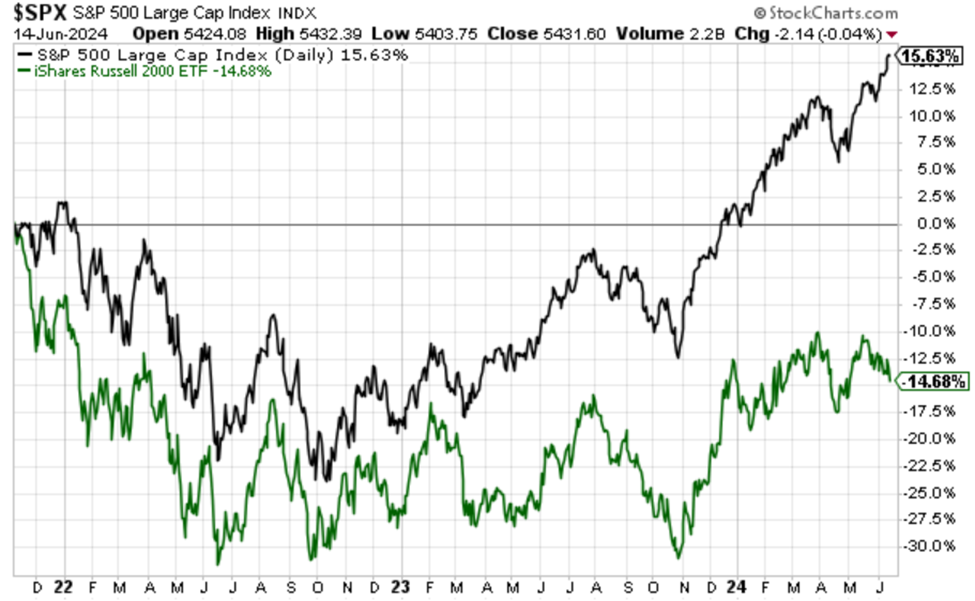
After all, small caps have woefully underperformed their large-cap counterparts for years.
As you can see below, since early-November of 2021, the iShares Russell 2000 ETF remains down 15% while the S&P is up 16%.
But three things are working in the favor of small caps as we look forward.
One – rate cuts from the Fed.
Due to their size, small-cap stocks are usually more sensitive to inflation and interest rates than large caps.
Smaller companies can be more vulnerable to rising operating costs during inflation. Also, they can find it tougher to adjust their prices to offset inflation and maintain margins.
But when interest rates fall, these dynamics reverse. So, if the Fed is on the cusp of rate cuts, it would be a big tailwind to small-cap stocks in general.
Two – small cap earnings are expected to soar.
For this, let’s go to Zachs:
The Russell’s year-over-year earnings are expected to grow a healthy 10% in 2024 and a robust 41% in 2025! Remember, markets tend to discount future earnings growth in advance.
For perspective, Louis Navellier’s favorite economist, Ed Yardeni estimates that the large-cap S&P Index will see earnings growth of just 8% in 2025. So, that 41% forecast is huge (and to be fair, 8% growth is pretty nice too).
Three – the market leadership of large caps over small caps is running long in the tooth, suggestive of coming outperformance from small caps.
Let’s jump to Cole Wilcox, CIO of Longboard Asset Management:
The current market leadership cycle between small and large has run longer than usual.
The chart below shows duration and magnitude of performance leadership cycles comparing U.S. large- and small-cap equities, 1932–2023(%).
Large caps have been on a 13-year winning streak, which has pushed small vs. large relative values to levels last seen in 2000, which marked the beginning of an 11-year outperformance cycle for small caps.
“The rumors of our death may be greatly exaggerated” -small cap fund managers.
We’re not the only ones to notice this small-cap opportunity
Our hypergrowth expert Luke Lango just brought it to the attention of his Innovation Investor subscribers.
From his Daily Notes yesterday:
Small caps can’t stay this cheap forever.
The divergence between small cap stocks and Big Tech stocks appears to have widened to a breaking point. The Russell 2000 to Nasdaq 100 ratio has collapsed to 0.1 – its lowest level ever. Even during the peak of the Dot Com Bubble, this ratio never dropped below 0.12.
We therefore think the divergence between small cap and Big Tech stocks has widened to a breaking point. Soon, small cap stocks will rebound with a vengeance.
We believe that will happen once the market gets more clarity on the timing and magnitude of rate cuts in 2024, which should come this summer with soft inflation data.
So, which small caps should you consider?
Since we mentioned Louis a moment ago, let’s highlight his free Portfolio Grader tool to help you with your hunting.
Regular Digest readers know that fundamental strength, as evidenced through earnings superiority, underpins Louis’ entire market approach. Fortunately, Louis has codified much of his proprietary quant-based market system, and now offers it to the investment community through his Portfolio Grader.
Think of it as a diagnostic that gives you an instant snapshot of a stock’s financial strength. It focuses on the same eight metrics that drive Louis’ stock selection process for all his premium investment services.
Feel free to run your small-cap ideas through the screener to see if they make the grade.
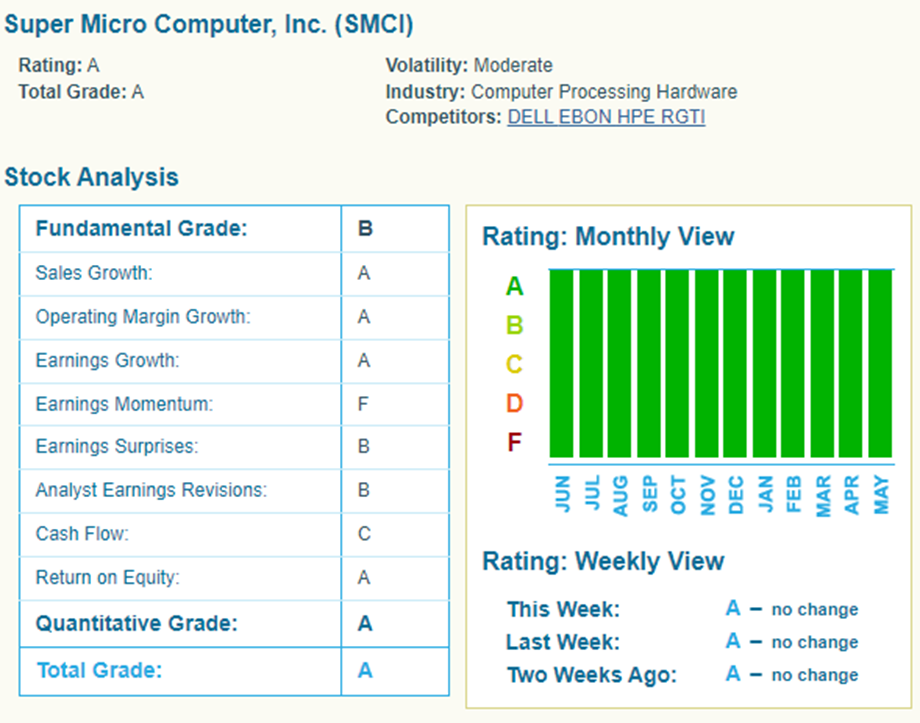
For example, here’s how Super Micro Computer looks in the Portfolio Grader. Louis’ system found it in August of 2022. Breakthrough Stocks subscribers are up 1,409% as I write Tuesday morning (members can login here).
Regardless of your preferred way of getting exposure to small caps, recognize the dynamics that are coming together
If the next 12-18 months bring Fed rate cuts… and soaring earnings as is forecasted… and the beginning of a new cycle of small-cap outperformance relative to large-caps… then you’re going to want major exposure to small caps in your portfolio.
In the meantime, be careful in this market. It’s not as strong as the headline returns would make you believe.
We’ll keep you updated.
Have a good evening,
Jeff Remsburg