Listen to the audio version of this article (generated by AI).
Micron earnings shatter records… PCE inflation hits 4.1%… but what about the inflation number Warsh is watching?… are we only in the 3rd inning of AI?
As I write on Thursday, Micron (MU) is up 14% after the memory chip giant reported blowout earnings yesterday after the closing bell.
The numbers were staggering…
Revenue hit $41.5 billion last quarter, up from $9.3 billion a year ago. Earnings came in at $25.11 per share adjusted, crushing the $20.28 Wall Street was expecting. Gross margins jumped to 84.9% – more than double where they were 12 months ago.
Then came the guidance…
Micron told investors to expect roughly $50 billion in revenue next quarter. Analysts had penciled in $43.6 billion. That’s not a beat. That’s a different zip code.
The story behind the numbers is straightforward: AI is eating memory chips faster than anyone can make them. CEO Sanjay Mehrotra was blunt on the analyst call – he can’t identify when the memory shortage will end:
Even as we expect industry supply to improve gradually in 2028, we currently do not have line of sight as to when memory supply will be able to catch up with increasing demand.
We expect tight conditions to persist beyond calendar 2027 as a result of AI-driven demand across all segments coupled with structural supply constraints.
To lock in this demand, Micron announced 16 long-term supply agreements with data center operators and other major customers, each covering three to five years. When complete, roughly half or more of Micron’s revenue will be committed under these deals.
That’s a fundamental shift for a business that has historically been hostage to boom-and-bust memory cycles.
Bottom line: The AI boom is alive and well, and despite some healthy profit taking today in tech, MU’s numbers bode well for the AI bull.
Meanwhile, the May PCE report dropped this morning
It showed headline inflation came in at 4.1% year-over-year, up from April’s 3.8% and the highest reading since April 2023.
Meanwhile, Core PCE – which strips out food and energy – came in at 3.4% year over year, slightly hotter than April’s 3.3%.
Cue the financial media commentary about Fed Chair Warsh remaining hawkish and rate hikes – not cuts – as the most likely next move.
Perhaps. But that reaction misses something important – the real number that Warsh is watching, which also dropped today…
And when you understand it, you’ll have a cleaner read on Fed policy than most investors and talking heads.
Warsh doesn’t primarily look at the same inflation numbers everyone else is watching
During his Senate confirmation hearing in April, he said that the Fed’s standard inflation gauge – the one that CNBC and others are splashing across their homepage this morning – is only a “rough swag” of actual price pressures.
“Swag,” he clarified, stands for “scientific wild guess.”
Instead, his preferred measure is something called the “trimmed mean PCE,” published monthly by the Federal Reserve Bank of Dallas.
The concept is worth a brief digression, because it will reframe how you read every inflation report going forward.
The standard PCE takes every item consumers buy – gasoline, groceries, streaming subscriptions, hospital visits – and averages all their price changes. That means a one-time spike in oil (say, from a Middle East conflict) gets baked directly into the headline reading, even if the rest of the economy is pricing normally.
Now, Core PCE does a better job of addressing this. It strips out food and energy prices.
But there’s a problem with Core too – it still absorbs every other price spike those energy costs trigger downstream.
While it overlooks spiking oil prices, it will count, for example, the skyrocketing airfares that airlines charge to recoup their soaring jet fuel costs. Because airfare is classified as a service, the energy shock sneaks into Core PCE through the back door – and gets mistaken for broad-based inflation.
Another example: Core PCE strips out “food purchased for consumption at home” (groceries). However, it explicitly includes “food services and accommodations” (dining out) as a service.
So, say you have an avian flu that pushes egg prices through the ceiling. That inflation could still show up when you dine out, even though it’s not expressed in Core PCE.
The solution – the inflation measure that Warsh prefers – is the “trimmed mean PCE,” which takes a different approach…
It lines up all those individual price changes from lowest to highest, lops off the most extreme readings on both ends of the spectrum – the temporary outliers, up or down – and then averages what’s left in the middle.
For Warsh, the result is a cleaner picture of the inflation that’s actually embedded in the economy, rather than the noise generated by geopolitical shocks.
To get a sense for the difference this can make, let’s rewind to last month.
April’s Core PCE ran at 3.3% year-over-year. However, the Dallas Fed’s trimmed mean for the same month was just 2.35%. That’s roughly one percentage point lower – sitting just above the Fed’s 2% target.
That’s a huge difference.
So, the issue coming into today that investors should have been watching wasn’t the headline or Core PCE numbers alone – it was the trimmed mean figure, and whether the spread between it and Core PCE would narrow, widen, or remain intact.
We got the answer…
What today’s trimmed mean numbers told us
A few hours after the PCE data dropped, the Dallas Fed published the May trimmed mean figure. The yearly number came in at 2.42% – just a hair above April’s yearly 2.35% figure.
Recognize what this means…
With Core PCE clocking in at 3.4% this morning, the gap between it and the trimmed mean (2.42%) remained at roughly a full percentage point.
This supports Warsh’s belief that stripping out extreme price outliers reveals an underlying inflation trend that approaches the Fed’s 2% target – and remains somewhat stable.
On that last note, here’s the yearly trimmed mean figures over the last six months:
- Dec: 2.4
- Jan: 2.4
- Feb: 2.3
- Mar: 2.4
- Apr: 2.3
- May: 2.4
While the hawkish camp will point to this morning’s one-month annualized ticking up to 2.8% as evidence of fresh short-term heat, the broader 12-month baseline proves the structural trend remains firmly anchored.
Bottom line: This was a win on the inflation front. And going forward, keep your eyes on the trimmed mean – that’s the number Warsh is actually watching.
Are we in only the 3rd inning of this AI boom?
Beyond writing the Digest, I also helm InvestorPlace’s Investing Insider newsletter where I feature interviews with our expert analysts, profile the research of major Wall Street investment shops, and highlight the most lucrative investment trends in the market.
In tomorrow’s issue, I sit down with legendary investor Louis Navellier, who makes a bold claim…
The AI boom may only be in its third inning.
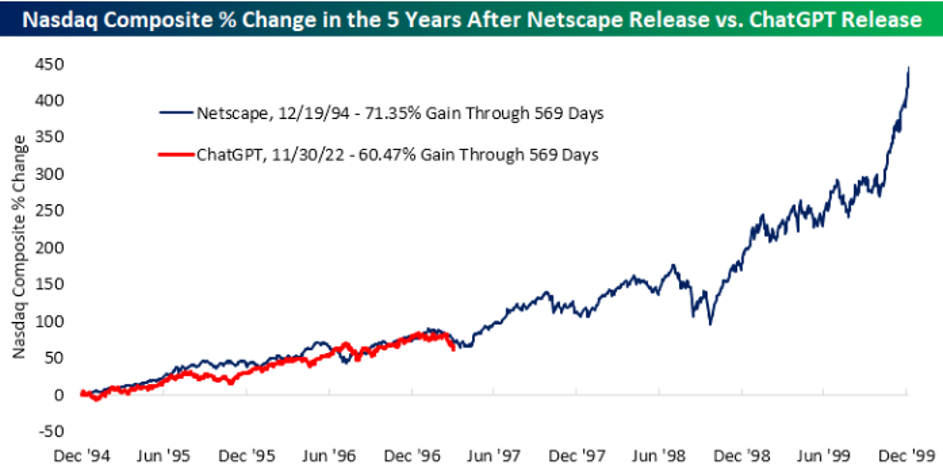
He points to a chart from the research shop Bespoke that overlays the Nasdaq’s trajectory after the ChatGPT launch against the same window following Netscape’s release in 1994.
As you’ll see below, the blue line is the Nasdaq’s performance in the five years after the release of Netscape, overlaid against the red line – the years after ChatGPT’s launch in late 2022.
Though the data only runs through spring 2025, the Nasdaq hasn’t gone down since then. If anything, the red line has continued to climb – meaning the comparison is likely still tracking.
Now, bears might read this and think, “No, we’re already in the 9th inning, on the verge of an AI bubble pop that will be every bit as brutal as the dot-com pop.”
Perhaps. But make sure to factor in one key difference…
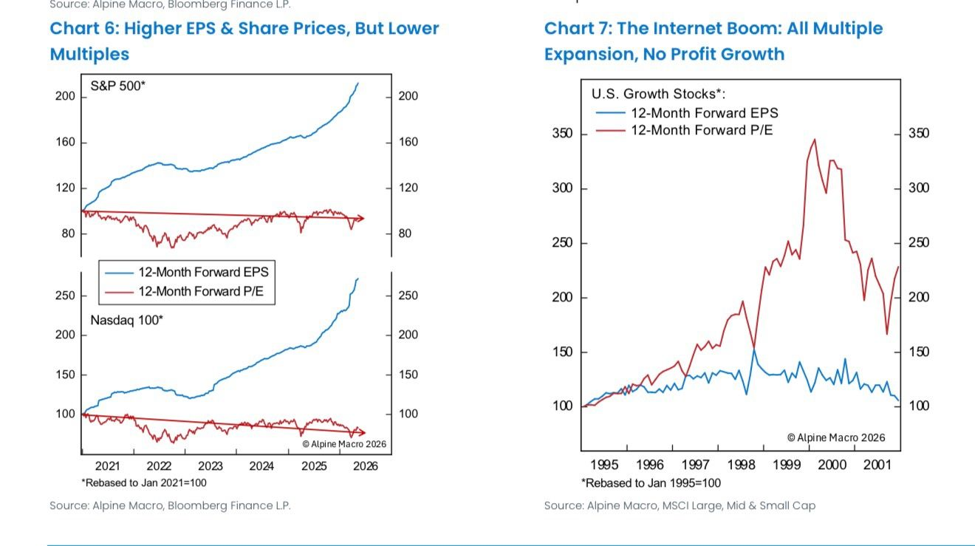
A chart from Alpine Macro shows that today’s AI boom has something the dot-com era didn’t have…
Real earnings growth, not just multiple expansion.
In the dot-com boom, P/E ratios went to the moon while profits barely budged. Today, earnings per share are compounding while multiples have stayed relatively flat. That’s a structurally different – and arguably more durable – setup.
See for yourself…
The pane on the left shows today’s AI boom with rising forward earnings and a largely flat forward P/E. The pane on the right shows the dot-com forward P/E soaring (then crashing) as forward earnings remained largely flat.
Source: Alpine Macro / Bloomberg Finance
One wrinkle here deserves a closer look, though
There are legitimate questions about whether some of today’s AI-based earnings growth is as clean as it appears.
A growing chorus of analysts is flagging a capex recycling loop: hyperscalers like Google and Microsoft are booking profits while funneling massive capex into AI startups that, in turn, consume those companies’ cloud and AI services.
For example, A cloud giant makes a multi-billion-dollar “equity investment” into an AI pioneer like OpenAI. That pioneer uses its newly acquired cash or cloud credits to train and run models.
The hyperscaler then recognizes those exact credits as “fresh, organic commercial cloud revenue” on its public income statements, padding its bottom-line growth and boosting its stock price.
Financial filings show that just two unprofitable startups – OpenAI and Anthropic – anchor over half of the roughly $2 trillion in future cloud backlogs held by Microsoft, Amazon, Google, and Oracle.
It’s not a smoking gun, but it’s a real risk that we’ll be tracking closely in the Digest over the coming quarters/years.
To watch the full interview with Louis, you can join us in Investing Insider right here.
And keep your eye out for tomorrow, when Louis will release his latest research package. It highlights a methodology for tracking where institutional money is moving before the rest of the market catches on.
We’ll keep you updated on all these stories here in the Digest.
Have a good evening,
Jeff Remsburg