Paul Tudor Jones says fireworks are coming… craziness in the venture capital market… why we’re “dancing close to the exit – but still dancing”… Luke Lango’s live event earlier today… charts you need to see
Legendary trader Paul Tudor Jones expects massive fireworks in the market.
From Jones, speaking on CNBC’s Squawk Box this morning:
My guess is that I think all the ingredients are in place for some kind of a blow off.
History rhymes a lot, so I would think some version of it is going to happen again. If anything, now is so much more potentially explosive than 1999.
Jones said that investors must remain nimble in this final stretch – “You have to get on and off the train pretty quick” – but echoed what we’ve written here in the Digest as to why you want to be the market (and be ready to exit):
If you just think about bull markets, the greatest price appreciations always [occurs] the 12 months preceding the top.
It kind of doubles whatever the annual averages, and before then, if you don’t play it, you’re missing out on the juice.
If you do play it, you have to have really happy feet, because there will be a really, really bad end to it.
So, how do we avoid that “really bad end”?
In last Monday’s Digest, we introduced our “Crazy Map” – a series of late-stage bull market milestones that line the path to the eventual peak/bust
Our goal is to track this late-stage craziness to help identify when to take profits off the table and step aside.
One of those milestones was “speculation over substance”:
Stock prices come to be driven less by profits and more by narratives – think the Dot-Com’s “clicks not bricks”, promises of crypto cutting out middlemen and upending all sorts of sectors, or “the next Amazon” …
[Today] AI start-ups with little revenue are getting triple-digit price-to-sales multiples, and some IPOs are doubling on day one (Figma and Circle Internet Financial).
Investors are looking for the “next big thing” narratives, even though cash flows/profits might be years away.
Well, we have new data to factor in…
Amazon founder Jeff Bezos raised this issue on Friday, speaking at Italian Tech Week in Turin, Italy.
From CNBC:
During bubbles, every experiment or idea gets funded, [Bezos] told the audience.
“The good ideas and the bad ideas. And investors have a hard time in the middle of this excitement, distinguishing between the good ideas and the bad ideas. And that’s also probably happening today,” Bezos said…
Bezos gave the example of a six-person company receiving billions of dollars of funding. This is “very unusual behavior,” and yet this kind of activity is happening today.
I’ve seen versions of this on a personal level in recent months. I occasionally invest in small venture capital startups through AngelList. Over the last year, the number of companies raising money with “AI” in their name has exploded.
Some are going out at early-stage rounds with valuations of $30M, $40M, even $50M+, yet have generated zero (or very little) in revenue.
Carta.com reports that seed valuations for AI startups were 42% higher than those of non-AI companies last year.
And here’s Reuters from last Friday:
Artificial intelligence startups are attracting record sums of venture capital, but some of the world’s largest investors warned that early-stage valuations are starting to look frothy…
“Any company startup with an AI label will be valued right up there at huge multiples of whatever the small revenue (is),” [Bryan Yeo, group chief investment officer at Singapore sovereign wealth fund GIC] said.
“That might be fair for some companies and probably not for others” …
“Market expectations could be way ahead of what the technology could deliver.”
And it’s not just private companies hopping on the AI bandwagon.
We’re even seeing some existing, publicly traded companies rebranding to leverage “AI” in their names:
- Sarcos Technology and Robotics >>> Palladyne AI
- The NFT Gaming Company, Inc. >>> Gaxos.AI
- Bionoid Pharma, Inc. >>> AI Maverick Intel, Inc.
- 1606 Corp >>> CBDW AI
So, where does this leave us?
Last Monday, we gave this “speculation over substance” category a score of “Yellow tilting Red,” on our Crazy Map, writing that “fundamentals are less important in the hottest corners of AI.”
Let’s go ahead and push that to full “Red” status.
This means two of our five categories are now officially in the “danger zone” (the other is “easy money and leverage”).
To be clear, we’re still riding this bull. Bullish momentum/trend can push stocks to stratospheric prices in the short term, vastly beyond what fundamentals warrant. And we’re not going to say “no” to those gains.
But we’re cautious, remaining nimble, and watching closely for too many scores switching to “Red.”
As the old saying goes, “As long as the music is going, keep dancing – but dance close to the door.”
Another “getting toppy” factoid to keep you dancing close to the exit
On Friday, MarketWatch featured an article highlighting why Bank of America’s chief strategist, Michael Hartnett, says this bull has more room to run.
Harnett explains that “every bubble in history [has been] popped by central-bank tightening,” and then he adds, “no central bank in the world has hiked rates in the last two months.”
While that’s interesting, our defensive mindset has us keying in on another detail in Hartnett’s research.
From MarketWatch:
Ominously, though, Hartnett noticed that, for the past five months, the low on the S&P 500 was recorded on the first day of trading.
This hasn’t happened since 1928, and most investors will be familiar with what happened a year later.
This reference to a “bust” somewhere on the road ahead recalls the recent timeframe from our technology/AI expert Luke Lango:
Some underlying warning signs—like inflation not yet at 2%, unemployment grinding higher, weak consumer health, and depressed sentiment—are caution lights flashing in the distance.
None of these derails the rally now. But it does remind us that this is a 12-month trade, not a forever trend.
Eventually, tariffs, reinflation, and political instability will weigh enough to flip the narrative from AI Boom to AI Bust.
But we’re not there yet…
Earlier this afternoon, Luke profiled one of the biggest investment opportunities on his radar today – “Project Yorktown”
This is his name for an urgent financial reset deemed so important that it won bipartisan support, setting aside Washington’s political gridlock.
According to Luke, this initiative traces back to a four-page document signed in the final weeks of Trump’s first term. The goal is to secure America’s financial independence from foreign creditors.
With U.S. debt topping $34 trillion, and rivals like China and Japan holding massive Treasury stakes, leaders on both sides of the aisle agreed the risk of foreign “financial blackmail” had become a national security threat.
“Project Yorktown,” set to take effect in two weeks on October 21 officially, outlines a new financial framework that could redirect as much as $4 trillion into a neglected corner of the market.
This afternoon, Luke explained why this shift could open a rare window for enormous wealth creation for prepared investors:
Some estimates suggest 10x gains in the next 12 months, 30x in the next three years, and even 100x by 2030 for those who understand where the money is going.
In today’s briefing, Luke also unveiled seven specific opportunities tied to this transition – including one free pick he says could double over the next 12 months.
If you missed it, the full replay is still available for a limited time, which you can catch right here.
Finally, let’s end today by returning to “crazy”
We’ll do so with the help of a few visuals that illustrate how wildly inflated today’s market is. They come from Charlie Bilello of Creative Planning.
To begin, the graphic below shows in shaded blue how many all-time highs the S&P posts in a year.
Note that the last time we had a stretch of blue this long (minus 2023) ended in 2000.
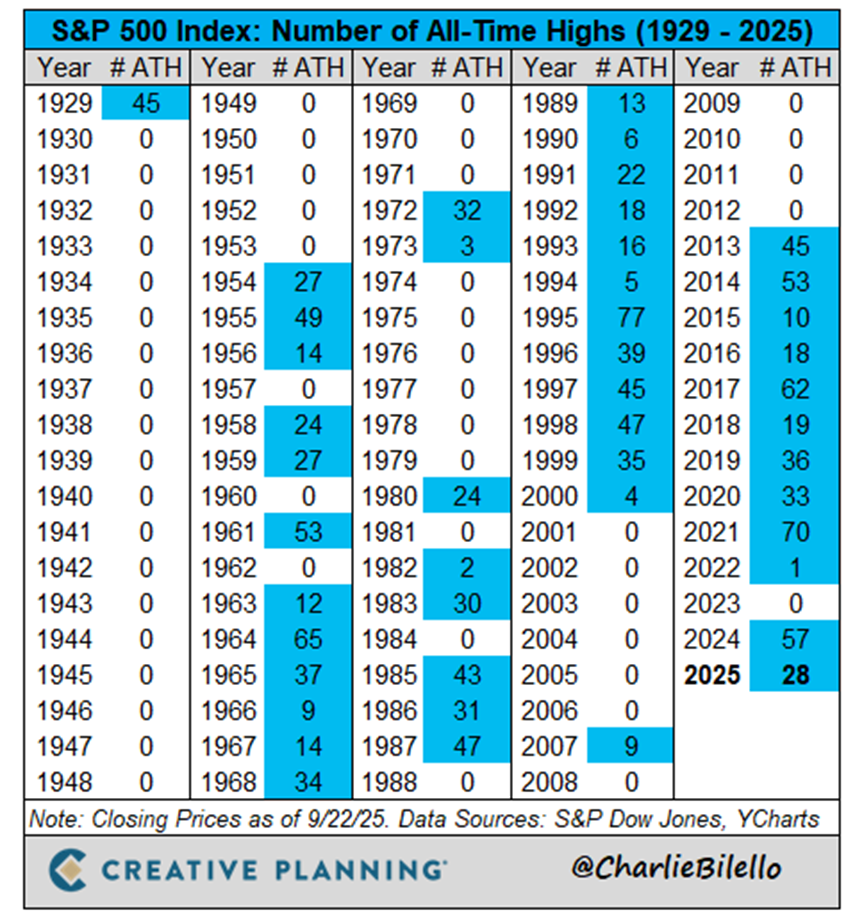
Source: Creative Planning / Charlie Bilello
Next, as you can see below, the S&P’s current price-to-sales ratio clocks in at 3.3. That’s the highest reading since 2000, and miles above the historic median of 1.60.
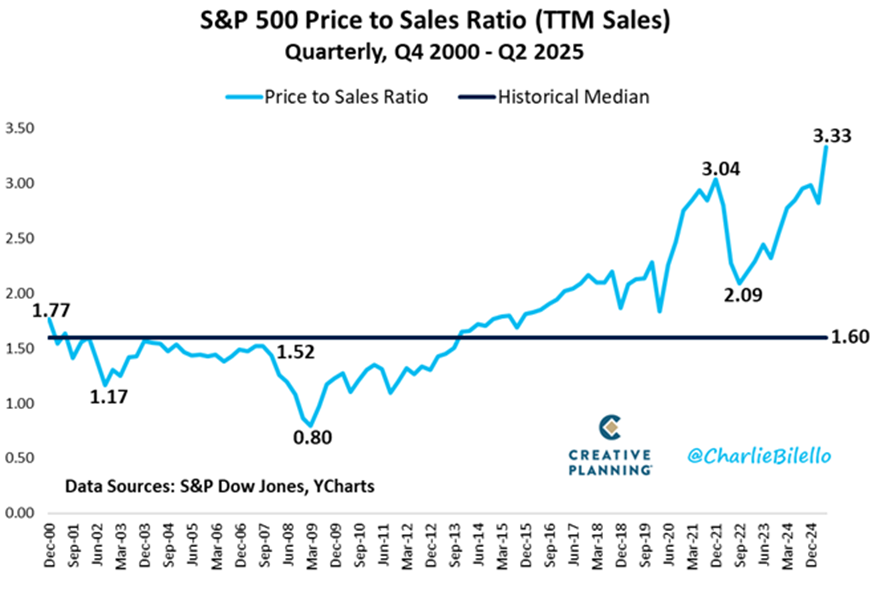
Source: Creative Planning / Charlie Bilello
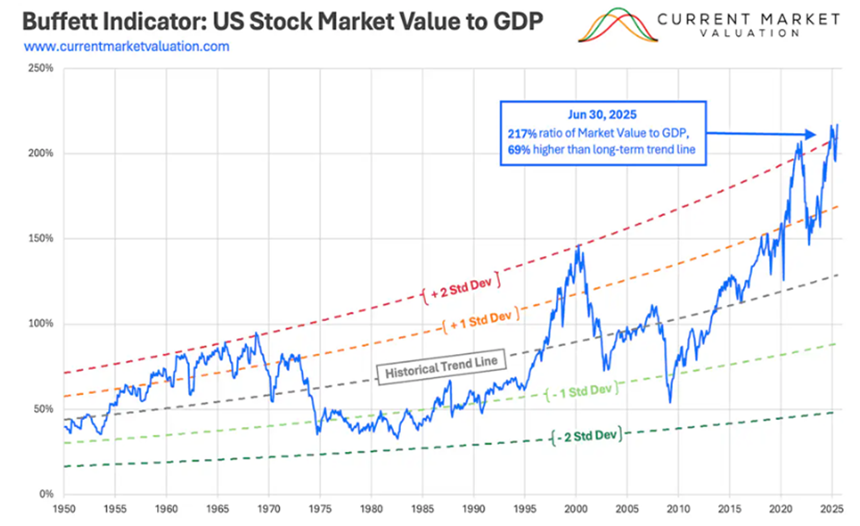
Finally, the “Buffett Indicator” – the ratio of the U.S. stock market’s value to U.S. GDP – has jumped to a new record high at 217%. That’s more than two standard deviations above the long-term trendline.
One more chart to use as a backdrop for these investment excesses…
Since we’ve regularly highlighted the bifurcation in the economy and stock market, let’s end with a sign of the times.
As you can see from the predictive markets website, Kalshi, using data since 2004, searches for “second job” just hit an all-time high. They’re north of the peaks from the 2008 Financial Crisis and even COVID.

Let’s close today by revisiting the old market saying we highlighted earlier:
As long as the music is going, keep dancing – but dance close to the door.
Have a good evening,
Jeff Remsburg