China ratchets up trade tensions… is this what kills the bull?… another billionaire sounds off on an AI bubble… do you have your exit plan?… last call for Keith Kaplan and tomorrow’s Super AI Trading Event
Tensions with China took center stage again this morning, driving stocks sharply lower before buyers stepped in after lunch.
Investors woke to news that China’s Commerce Ministry announced sanctions against five U.S.–based subsidiaries of South Korea’s Hanwha Ocean, while barring Chinese entities and individuals from doing business with them.
From a Chinese government representative:
Hanwha’s subsidiaries in the U.S. have assisted and supported the U.S. government’s probes and measures against Chinese maritime, logistics and shipbuilding sectors.
China is strongly dissatisfied and resolutely opposes it.
U.S. Treasury Secretary Scott Bessent immediately condemned the sanctions. He accused Beijing of trying to weaken the global economy, saying:
If they want to slow down the global economy, they will be hurt the most.
They are in the middle of a recession/depression, and they are trying to export their way out of it.
The problem is they’re exacerbating their standing in the world.
Will the China/U.S. trade war be the straw that breaks the bull market’s back?
No, according to our technology expert Luke Lango, editor of Innovation Investor:
Both sides know a real rare earths trade war is bad news.
The U.S. can’t afford higher costs in AI chips and EV batteries. China can’t afford to alienate one of its biggest customers.
Trump doesn’t want markets in freefall. Chinese leader Xi Jinping doesn’t want China’s export machine crippled.
So, what happens next?
The two sides talk. Trump is already de-escalating. China will follow.
Trump and Xi are scheduled to meet later this month. They’ll come to some agreement — maybe a licensing framework, maybe a phased export quota, maybe a cooperative supply deal. But either way, it won’t be the all-out war that headlines imply.
Even if the trade spat is not a bull market killer, we’re not out of the woods. What about the risk that we’re in a rapidly inflating AI bubble?
And if we are, how close to the “pop” are we?
Another billionaire suggests there’s room to run
Last week, legendary investor Paul Tudor Jones sounded off about an AI boom before the eventual bust:
My guess is that I think all the ingredients are in place for some kind of blow-off.
History rhymes a lot, so I would think some version of it is going to happen again. If anything, now is so much more potentially explosive than 1999.
Yesterday, billionaire investor Howard Marks, the founder of Oaktree Capital, said we’re not yet seeing the signs of craziness that usually mark the top:
Valuations are… high but not crazy…
To me, the main ingredient in bubbles is psychological excess… some kind of temporary mania…
I don’t detect that level of mania at this time, so I have not put the bubble label on this incident… it just hasn’t reached that critical mass of mania.
So, if we’re not yet in that final inning – yet we’re close – it means the biggest gains remain ahead. We want exposure to that.
But we need to go in with open eyes and realistic expectations. After all, if we’re headed toward a bull market peak that resembles the Dot Com era, days like last Friday, where the Nasdaq fell about 3.5%, will be more common. We need to prepare for heightened volatility.
For overall context, here’s a one-year chart of the Nasdaq 100 before its Dot Com peak
As you can see, it jumped well over 100% that year alone.
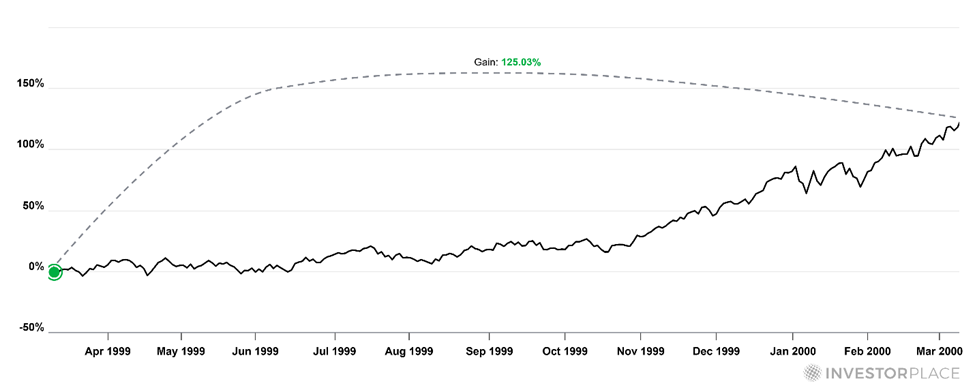
But zero in on the period after 2000…
Between January 1, 2000, and February 25, the Nasdaq fell 9.25%. It then surged 10%… crashed about 10%… surged roughly 8%… then began its steeper – yet still volatile – collapse.
Here’s additional color on the enormous volatility near the Dot Com peak from a Bank of International Settlements study:
The annualized volatility of daily returns on the Nasdaq index rose from 27% in 1999 to 51% in the first quarter of 2000.
During the first few months of 2000, prices of technology stocks often swung wildly during the trading day. On 5 April, for example, the Nasdaq index fell by 15% during the day, only to recover most of its losses by the close.
As measured by the difference between the day’s high and low prices, the average intraday volatility of the Nasdaq Composite soared from 14% in 1999 to 36% in the first quarter of 2000.
Imagine watching your portfolio value swing 36% within a single trading session.
I’m not suggesting that degree of volatility is right around the corner. But if we’re truly entering the final inning of this bull, the rollercoaster market action of the last few days isn’t an anomaly, it’s the new normal.
So, if you want to ride it, emotional preparation now is critical.
To ride or not to ride, that is the question
Whether you decide to ride the upcoming volatility or choose to go more defensive, the key is intentionality. Take a moment today to assess your ability to wade through a significant market correction, as well as the potentially wild price swings that are likely to precede the eventual crash.
Consider your income, expenses, job security, time to retirement, major expenses coming due over the next year or two, not to mention your peace of mind – and weigh the trade-off between additional potential upside and prospective downside.
With all relevant factors clearly identified and on the table, how close to the sun do you want to fly?
Without that clear definition, your “when to sell” point will be fuzzy – and that’s when emotion sneaks in and does damage.
But recognize that there’s no free pass. The chart below comes from Charlie Bilello, Chief Market Strategist at Creative Planning.
As he writes:
Since 1980, the S&P 500 has an annualized total return of 12% despite an average intra-year drawdown of -14%.
No risk, no reward.

Our plan for a market downturn…
We’ll look to exit within a reasonable window after what we believe is the top, guided by our Crazy Map, Brian Hunt’s A-B-C framework (detailed in yesterday’s Digest), and a close eye on volume.
We’d love to have you around for the ride, but you must decide now when you’ll want to hop off the bus.
The good news is that if Brian’s right, you still have plenty of time to ride:
I seriously doubt the stock market is near a top today. I believe world governments are pumping enough liquidity into the system to drive stock prices higher and higher.
I believe exponential technologies are creating incredible narratives and big new markets that are drawing in big investment dollars.
But remember, those are forecasts.
That’s my take on market fundamentals. And fundamentals are of secondary importance. Price action is of primary importance.
Price action is how we will know this wild AI-fueled bull market is due for a major correction or something worse.
We share Brian’s perspective (which mirrors that of Luke and the rest of our analysts to varying degrees, for that matter). But our exit plan gives us the peace and confidence to keep riding this bull.
We encourage you to give yourself that same peace.
If you need a little motivation
We’re bullish but not blind.
Here are a few additional statistics from Bilello that illustrate why creating your exit plan is important…
- AI enthusiasm has helped propel the S&P 500 up 248% over the past decade. Meanwhile, corporate earnings have grown by a comparatively modest 156%.
- That disconnect has pushed valuations to extremes. The S&P 500’s price-to-peak-earnings multiple now stands at 27.9 – the highest since the year 2000 – while its dividend yield has fallen to 1.17%, also the lowest since 2000.
- Last week, the Nasdaq broke through 23,000 for the first time. It climbed from 22,000 to 23,000 in only 27 days – the fastest 1,000-point jump the index has ever made.
- If the S&P 500 tacks on just another 5% before year-end, it will again outperform every major Wall Street forecast – for the third straight year.
- Now, remember the economy in all this. There are about 157,000 more unemployed Americans than available job openings – the widest gap (outside the 2020 recession) since 2017. Meanwhile, U.S. employers have announced the lowest year-to-date total of hiring plans since 2009.
Now is a good time to recall the wise words of Benjamin Franklin:
By failing to prepare, you are preparing to fail.
A final reminder about tomorrow’s AI Super Portfolio event at 10:00 a.m. Eastern
If we’re right that we’re in a late-stage bull and the biggest returns remain ahead, how do you find them?
Keith Kaplan, CEO of our corporate affiliate TradeSmith, has the answer: cutting-edge machine learning.
His new breakthrough system has shown average annual gains of 374% in testing – and that’s without leverage or complicated strategies such as options.
This is a five-position rotating portfolio of stocks that the screening AI identifies as having the highest probability of outperforming over the coming months. Just buy them, hold for AI-determined periods, and rebalance twice a year. It’s that simple.
Here’s Keith with the back-tested returns:
Last year alone, you could have made a 602% gain with this five-stock strategy.
That’s more than 30x the return you’d have gotten holding the S&P 500 stocks for the year.
And it’s more than 3x the return of Wall Street darling Nvidia (NVDA) over the same time…
Even better, it’s simple to follow. With just a couple of minutes’ attention every week, it crushes the returns most investors are making.
Keith will tell you more tomorrow at 10 a.m. ET during his Super AI Event. I’ll note that he’s planning to pass along one of the top trades his system has identified as a thank you for joining.
Secure your spot right here, and we’ll see you there.
Have a good evening,
Jeff Remsburg