
Editor’s Note: JR here. On Monday, I went live with the biggest event in Masters in Trading history — The Profit Surge Event.
I revealed all the details behind my winning approach to trading Unusual Options Activity (UOA). And I even provided some free stock picks to anyone who joined.
I showed viewers the exact approach we’ve used all year to stay ahead of massive shifts in precious metals, commodities, tech stocks, and much more.
I even invited three of the best stock pickers in the business — Louis Navellier, Eric Fry, and Luke Lango — to share their highest-conviction plays. These are the names they’re watching most closely right now.
If you weren’t able to join me on Monday, I’m offering a replay of the full event free for a limited time.
You’ll also get access to a free report with three high-conviction stock ideas I believe are positioned for outsized upside.
Click here to watch the full replay of The Profit Surge Event right now.
If you’ve spent any amount of time with me watching Masters in Trading Live, you know I don’t waste time chasing headlines.
I don’t care how confident someone sounds on television. I don’t care how dramatic the headlines are. I don’t care what the narrative of the week is supposed to be.
None of that will ever move a market the way actual capital does.
After more than two decades trading professionally — managing risk across global futures, equities, and options; executing institutional order flow; and teaching traders around the world — I can tell you with complete confidence that tracking that capital flow through objective, measurable, repeatable data is the only reliable way to make decisions in this business.
Data doesn’t bend to emotion. It doesn’t get caught up in narratives. It doesn’t change because someone on TV gets excited or panicked.
Data simply reflects what’s happening inside the market in real time, where every decision has consequences and every trade is backed by actual dollars at risk.
That’s how I learned to trade. It’s how I trained other traders. And it’s how I continue to teach inside Masters in Trading today.
Data Over FOMO
This may sound obvious, but most traders — especially newer ones — don’t actually operate this way. They react to stories. They trade off instincts. They’re afraid of missing out on the next big thing. They frame every move in terms of “why” instead of “what.”
But professionals don’t trade that way.
We never put capital at risk without a reason backed by objective data.
Because while headlines may create volatility, markets themselves run on cold, hard math — hedging pressure, volatility expectations, liquidity flows, and institutional positioning.
If you’re not anchored to hard data, you drift into other people’s interpretations instead of seeing the market for what it actually is.
Objective data is the great equalizer. It moves you out of the world of predictions and into the world of probabilities.
When you understand what the market expects, how often price stays inside those expectations, and how market makers hedge around those zones, you’re not trading guesses anymore.
And when you can quantify order flow — when you can actually see where large amounts of money are being deployed — everything changes. You stop chasing the market and start following the participants who actually move it.
This is the foundation of everything I teach. It’s why we’re constantly on the hunt for unusual options activity. And it’s why we watch the expected move like a hawk.
Why Expected Move Matters More Than Headlines
The expected move is one of the simplest, most powerful pieces of objective market data available. It looks like two lines on a chart, but those lines carry a tremendous amount of information. They tell you, in plain mathematical terms, how far the options market expects a stock or ETF to move over a defined period.
Here’s how it works. Option prices tell us how “wiggly” traders think a stock will be in the future. We call that wiggle, volatility.
Professionals then convert that yearly volatility into a weekly or monthly number using a simple math shortcut.
Once we know how big the volatility is, we can use it and the current stock price to create our expected range. We add it to the share price for the upper limit and subtract it from the share price to determine the lower limit.
Here’s what the monthly move looks like for the Invesco QQQ Trust (QQQ):
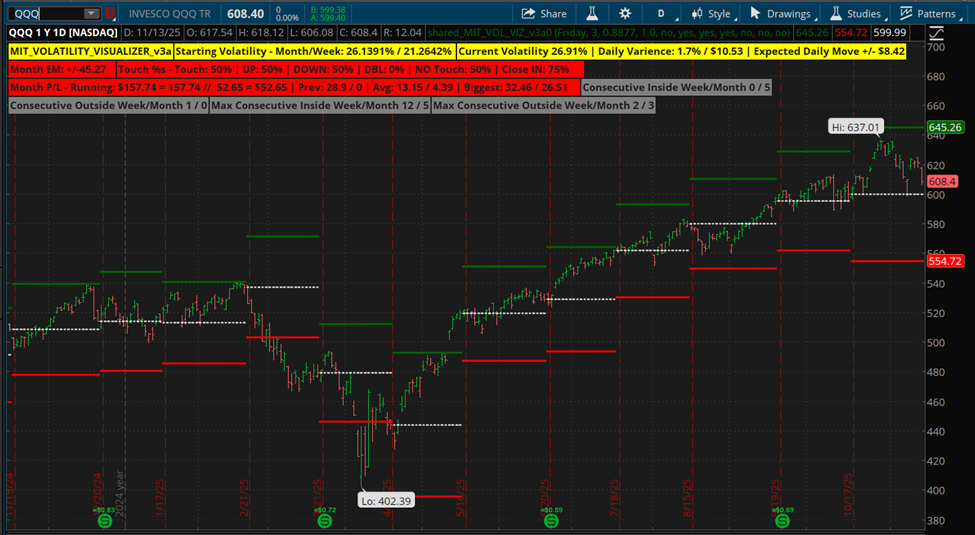
Most of the time — roughly two-thirds — the stock stays inside those lines. For some big names like Apple Inc. (AAPL), it stays inside the expected move almost three out of every four times.
That’s why traders treat the expected move like a map. It shows where the price is likely to travel and where something unusual might be happening.
So when a stock drops down to the lower line or rises to the upper line, professional traders pay attention.
That’s where big players adjust their hedges. That’s where liquidity ebbs and flows. That’s where institutions choose to act.
Headlines might make the market seem chaotic, but the expected move gives you an objective measure of what’s normal — and what isn’t.
And to see how powerful that can be, look at gold.
Gold Hits Its Expected Move — and the Real Buying Shows Up
Gold has been in a strong uptrend for most of 2025. But what matters for professional traders isn’t the storyline of why gold is strong — it’s the structure of how gold moves relative to its volatility.
After months of steady upside, gold finally pulled back. And that pullback behaved exactly the way expected-move math suggests it should. Volatility stayed stable. Selling dried up right at the boundary. Market makers eased hedges. Price stabilized.
This is the kind of moment professionals watch closely.
When price respects the expected move this cleanly, it tells you the market is behaving according to its statistical structure. That’s your setup. But the setup isn’t enough — the confirmation comes from capital.
And we didn’t have to wait long. Take a look at this chart of the SPDR Gold Trust (GLD)
Right as gold touched its expected move, the institutions showed up. In one session, more than $14 million in GLD call premium hit the tape — versus only about $2 million in puts.
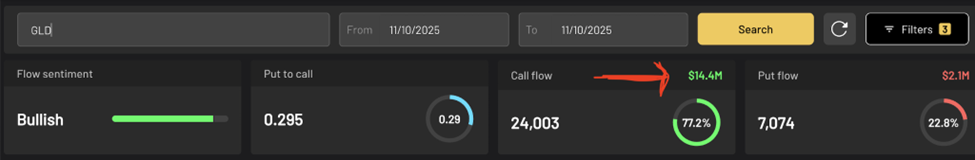
That kind of buying doesn’t come from everyday traders. It’s big-money traders stepping in at a mathematically significant level.
Earlier this week, I dove deep into gold’s big move and the institutional money fueling it. You can watch my full analysis ight here .
Once you understand the expected move and know how to read this kind of buying, you don’t need headlines to tell you what’s happening — the data does.
Structure + Flow: A Repeatable Edge
Stories have their place. They can help us hunt for opportunities. Whether it’s AI, energy, gold, data-center buildouts, or a shift in Federal Reserve policy, narratives help us know which parts of the market are making waves.
But we never trade stories on their own.
We always want to see real money stepping in — big, decisive institutional flow — before we put our capital at risk.
That’s why we track unusual options activity. That’s why we study the expected move.
The biggest winners we’ve had this year — like the 534% and 700% trades in MP, or the 275% return in ETHA — didn’t work because we simply “liked the story.” They worked because the story lined up with structure, and structure lined up with flow.
That is exactly why I hosted this year’s Profit Surge Event. I wanted to show which sectors are attracting fresh liquidity, where institutional money is concentrating, and how traders can position themselves ahead of that cycle.
If you’re serious about understanding the environment we’re entering, follow this link to find out all about it.
Seeing What Others Miss
Markets reward the traders who can separate noise from signal.
The traders who cling to stories without data get shaken out more often than not.
But the traders who track institutional flow, who understand the expected move, and who have the discipline to let data guide their decisionsare the ones who stay in control no matter what the market throws at them.
Gold is a perfect example of that discipline. It pulled right into its expected move, institutions stepped in with size, and the data confirmed the turn long before the headlines caught up.
That’s the edge we want on our side. That’s the approach that keeps us grounded. That’s how you stay creative and on the right side of the biggest moves this market has to offer.
And the creative trader wins.
Jonathan Rose
Senior Analyst, InvestorPlace