It’s no secret the iShares Russell 2000 Index (ETF) (IWM), along with other market barometers, have traveled much further and longer off the 2016 corrective lows than most likely thought possible.

 But small caps, which led the way lower, suggest this is nothing more than a big ol’ opportunity for bears to reload in the IWM. Let me explain.
Just two months into the rally, if we’re listening to CNBC and other media outlets, the party for bullish investors may seem like it’s just getting started.
But if history is any indicator, which we feel certainly has a knack for rhyming, it actually isn’t. In fact, the market has gotten well ahead of itself — well almost, in the IWM.
As Jesse Felder shows, most evidence points to an overbought market. But if you’re watching small caps and the IWM, it definitely looks a bit less euphoric than in the S&P 500 or Nasdaq Composite. In fact, it even looks downright bearish.
IWM Stock Weekly Chart
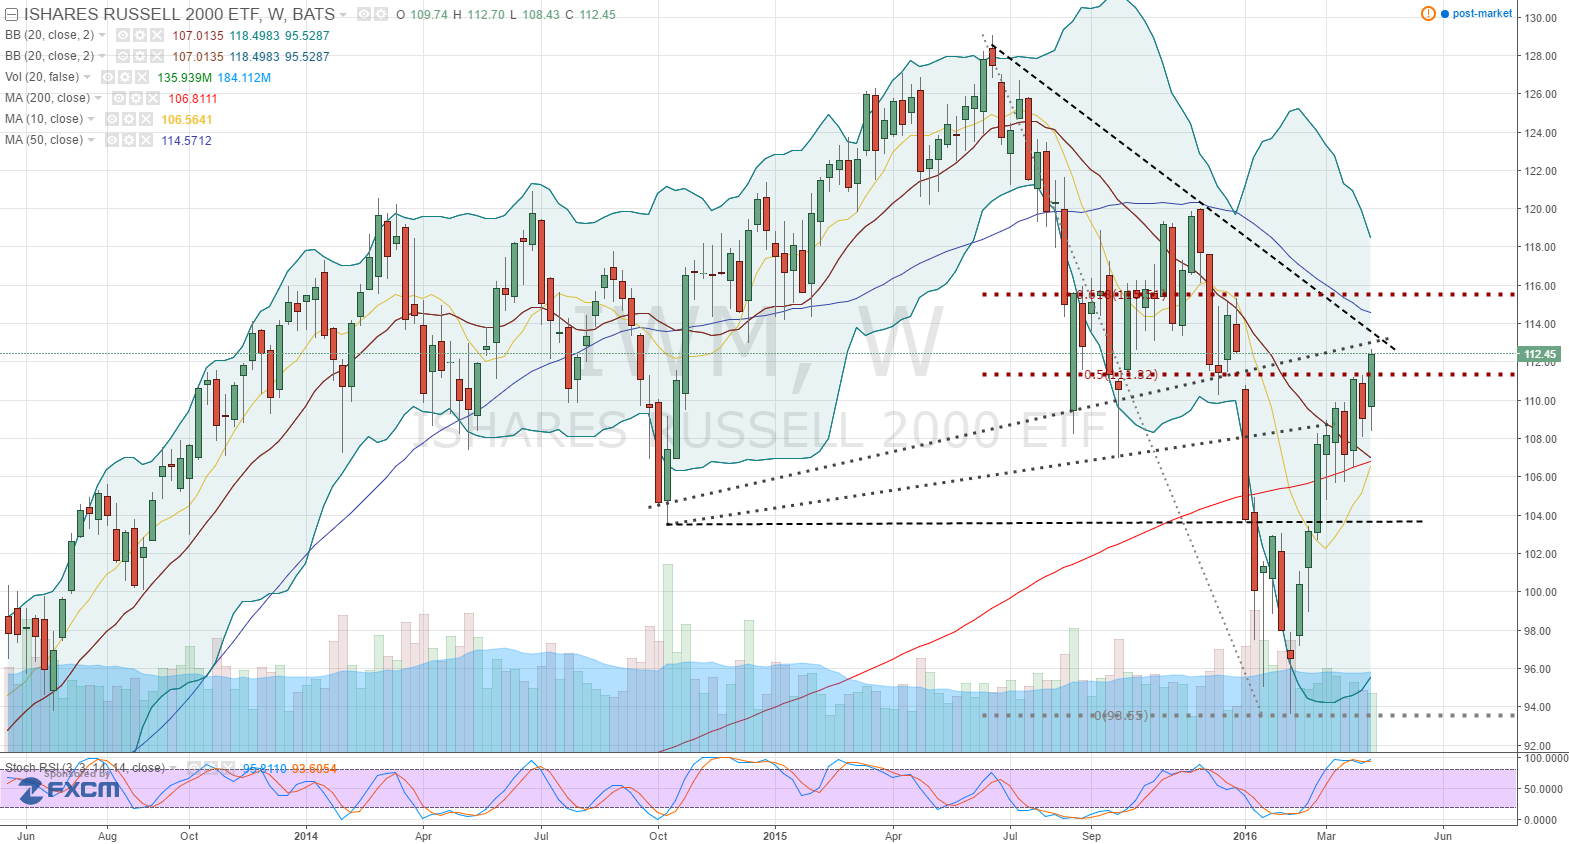
Click to Enlarge
Bear market rallies like the one in IWM are notoriously strong by nature. This one is no different, except that small caps continue to demonstrate relative weakness — a warning sign to investors.
Nonetheless, the Russell 2000’s strength has likely pushed all but the most staunch bears to capitulate — forcing sidelined bulls to jump back into the Russell 2000 ETF, well-removed from the more hostile and uncertain low.
And that, of course, clears the way for lower prices in the IWM!
Now with the rally of the past two months squaring off against formidable Fibonacci and trendline resistance, and the CBOE Volatility Index flashing far-from-fearful readings bordering on a “this time it’s different” mentality, the IWM is in prime position to reverse lower.
IWM Bear Put Vertical
Reviewing the IWM options board, the July $110/$103 bear put spread fits in well with view of the Russell 2000’s countertrend rally having run its course.
Priced for $1.70, this IWM vertical’s breakeven is 3.70% lower at $108.30. At the same time, its max gain of $5.30, a return of 311%, requires an expiration move below $103 or roughly 8.50%.
To be fair, that may sound like a big move in the Russell 2000 is required, but remember a price decline in the near term will immediately build profits.
Given the Russell 2000 ETF’s massive move of around 20% over the past two months, having a favored entry point on the price chart, three full months for positioning and very modest Greek risks makes for an attractive way to play a bear in bull’s clothing.
Investment accounts under Christopher Tyler’s management do not currently own positions in any of the securities or their derivatives mentioned in this article. The information offered is based upon Christopher Tyler’s observations and strictly intended for educational purposes only; the use of which is the responsibility of the individual. For additional market insights and related musings, follow Chris on Twitter @Options_CAT.