With Apple Inc (NASDAQ:AAPL) earnings now out of the way, traders are turning their attention to Tesla Inc (NASDAQ:TSLA). Elon Musk’s flagship is slated to report earnings Wednesday after the closing bell. Shareholders are hoping some of Apple’s magic, which sent shares up 6% in today’s premarket trade, will rub off on TSLA stock.
 Rather than flying blind into tonight’s event, let’s take some time to chronicle Tesla’s recent journey and identify what the Street is expecting into earnings.
Tesla’s Charts
Tesla heads into this evening’s release in desperate need of a positive catalyst. Although Tesla stock is up 50% year-to-date, it has suffered notable technical deterioration over the summer.
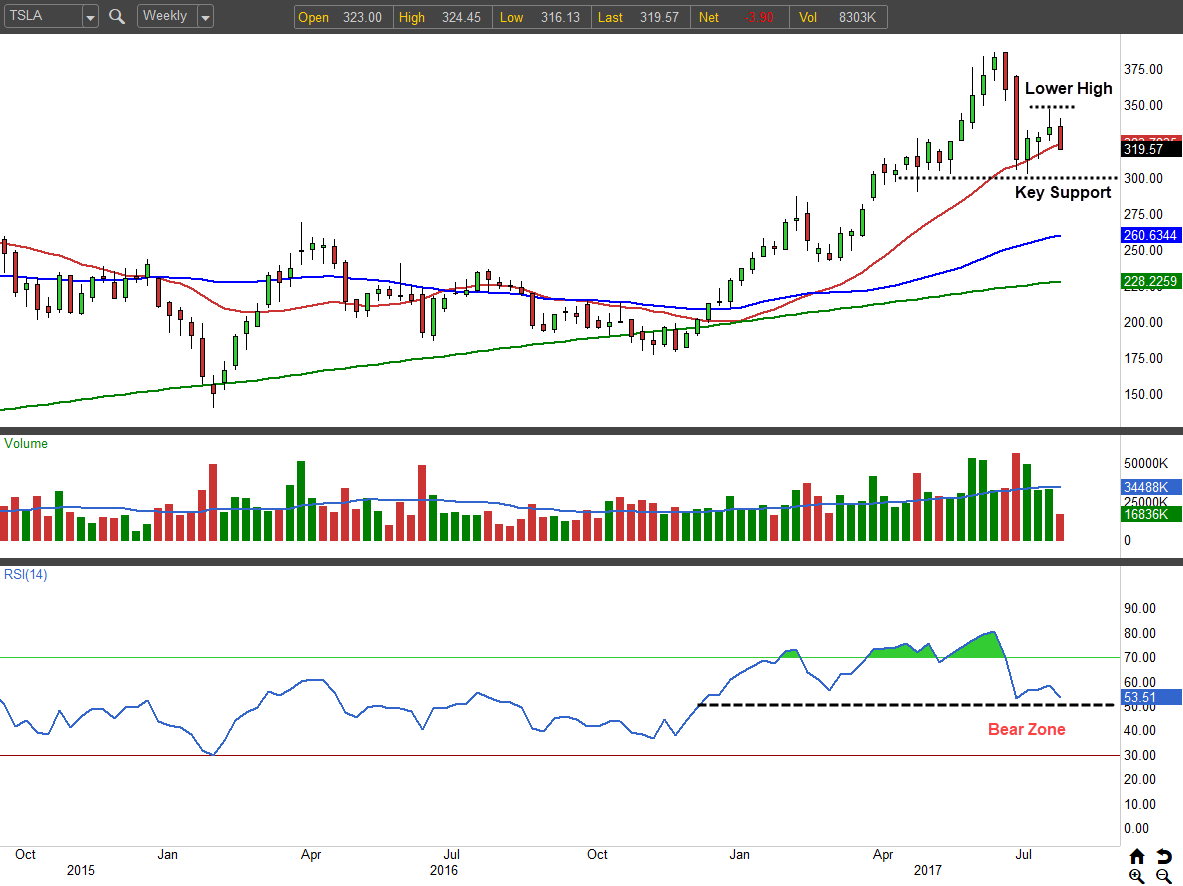
Last month’s failed rebound created a lower pivot high on the weekly chart which is threatening the integrity of Tesla’s uptrend. Buyers better defend the $300 level if the stock stumbles on earnings. Otherwise, you can say sayonara to its once-glorious uptrend.
Click to Enlarge
The other item of note on the weekly is the Relative Strength Index’s (RSI) indicator’s current position at 53.51. While it’s still in the bull zone (any reading above 50 is positive), it’s getting close to crossing into bear territory. Buyers need to step in pronto, or they’ll lose control of this momentum indicator alongside Tesla’s price trend.
Drilling down to the daily chart shouldn’t bolster the bulls’ confidence. It looks even worse than the weekly.
The primary pattern dominating the past quarter is the potential head-and-shoulders pattern. TSLA stock never fully recovered from the early-July dive. It’s failed rebound formed the right shoulder of the pattern (which corresponds with the lower pivot high on the weekly time frame). With this week’s rollover, Tesla finds itself back below the 50-day and 20-day moving averages.
Until it’s able to pop back above $348, I remain skeptical of any rallies.

Click to Enlarge
The neckline of the head-and-shoulders setup rests near $308 so a significant breach of that level would complete and confirm the potential reversal pattern. Bull markets tend to wreck all sorts of topping patterns, so I’m hesitant to get overly bearish here.
Nonetheless, until buyers can get Tesla back above the right shoulder ($348), there are better stocks to buy.
One final note regarding the RSI: It’s in bear country on the daily chart at 40, which confirms a cautious take on Tesla for now. A pop above 54 would provide an all-clear signal.
Market Expectations
Derivatives traders have long used option prices to gauge market expectations for news events like earnings. Are the masses expecting TSLA stock to stage a monster move in response to earnings? Or is it anticipated to be a snoozer? Such questions are quickly answered by a brief glance at the options board.
Currently, the August weekly options straddle is trading for $20. That means traders are pricing in a 68% chance that Tesla moves within a range of up/down $20 over the next three days.
If we divide that into its current share price of $320, we get a potential percentage move of up/down 6.25%. Now, bear in mind that includes the entire trading sessions of Wednesday, Thursday, and Friday so the post-earnings gap that will transpire overnight should be a touch less.
How to Trade TSLA Stock
Traders have three ways to position themselves ahead of the event. You can lean bullish or bearish, or place a non-directional volatility bet. A $20 move seems in line with what we’ve seen in recent quarters, so I don’t find the expectations all that surprising.
I’ll throw out two ideas and allow you to pick your poison.
Bull: If you’re willing to bet TSLA remains above its 200-day moving average for the next month, sell the Sep $270/$265 bull put spread for 70 cents. The max reward is $70, and the max risk is $430.
Bear: If you’re banking on the prescience of the recent topping formation, sell the Sep $375/$380 bear call for 52 cents. The max reward is $52, and the max risk is $448.
As of this writing, Tyler Craig did not hold a position in any of the aforementioned securities. Want to learn how to master the art of option selling for high-probability cash flow? Check out Tyler’s recently released video series through Tackle Trading on how to systematically sell iron condors for monthly income.