To receive further updates on this Knight-Swift Transportation Holdings Inc. (NYSE:KNX) trade as well as an alert when it’s time to take profits, sign up for a risk-free trial of Power Options Weekly today.
NOTE: U.S. markets will be closed all day on Monday, Jan. 21, for Martin Luther King, Jr. Day, therefore the next Trade of the Day will hit your inbox on Tuesday, Jan. 22.
This morning I am recommending a bearish trade on Knight-Swift Transportation Holdings Inc. (NYSE:KNX), a North American truckload services company.
The technical bounce off of the Dec. 26 lows has continued this week. It’s gone much further than many on Wall Street expected, which is typical of a bear-market rally.
Usually during a snap-back rally like this, you will see a recovery of roughly 50%-75% of the original downside move…especially when markets become as oversold as they were in late December.
As of yesterday’s close, the S&P 500 has now recovered roughly 50% of the decline that began all the way back in early October. It’s possible that it could rally further, but I think we are seeing a potential “bull trap” being set up here.
The Bull Trap
A bull trap occurs when traders start to buy back into a market that is rebounding from a previous decline, only to see the market start to drop once again. If and when the market starts to decline again, the bulls who bought near the top of the most recent upswing will find themselves “trapped” in their long positions.
If the market starts to move sharply lower again, they will be forced to exit their positions, which will only accelerate the selling.
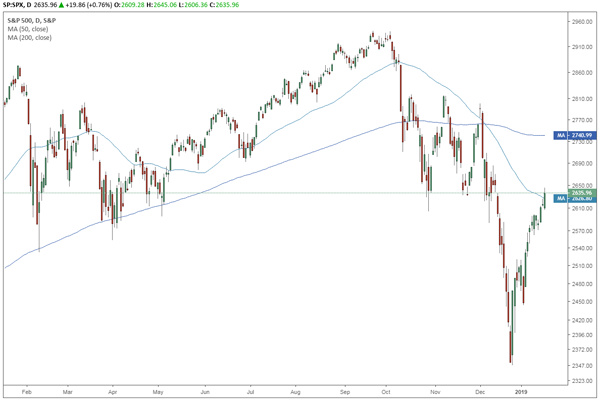
As you can see in the chart above, the S&P 500 is now trading back within the 2,600-2,640 resistance area. This is where a lot of investors who think the market is going to keep moving higher will start buying again. But unfortunately, I think this heavy level of overhead resistance is going to hold.
KNX is Following the Market
If we look at a weekly chart of KNX, we see that it, like the S&P, is dipping into its resistance around the $32 level. KNX may look like it is recovering, but trader’s buying in now could get trapped at this level.
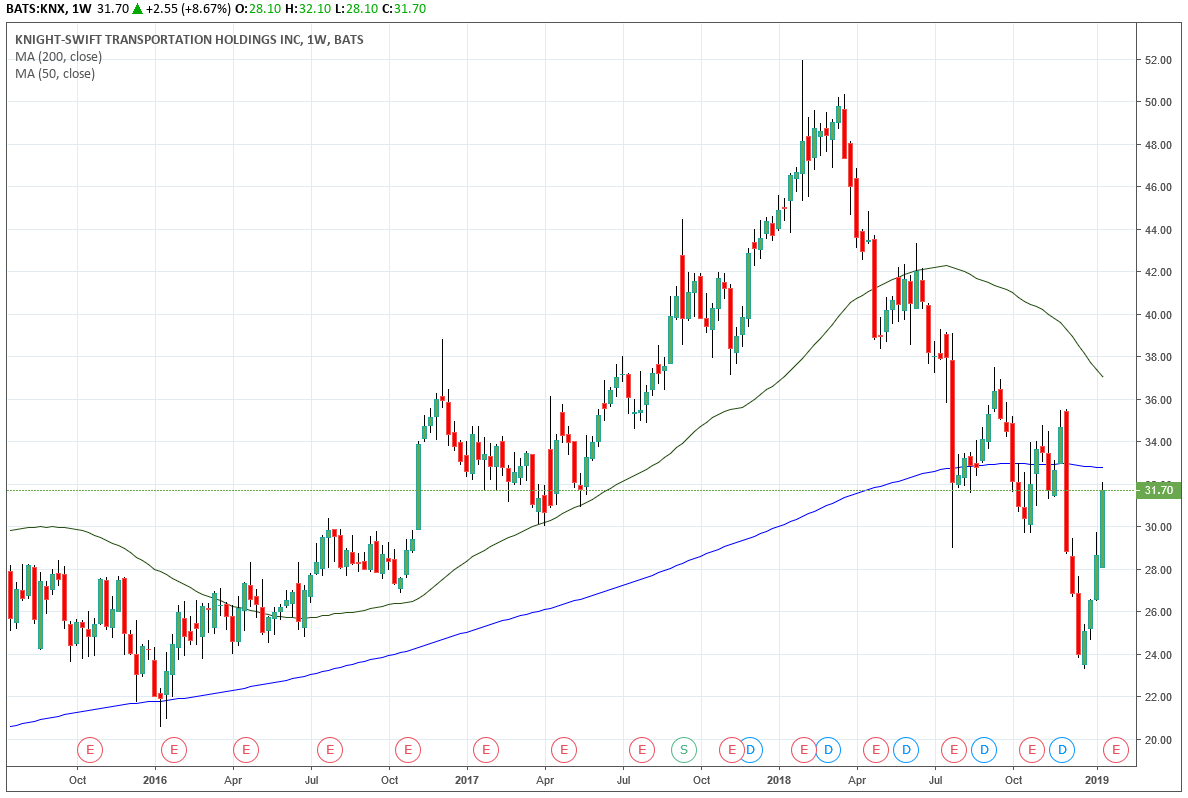
Weekly Chart of Knight-Swift Transportation Holdings Inc. (KNX) — Chart Source: TradingView
When we turn to the daily chart, we see a more detailed view of KNX’s resistance levels. It was able to gap above $30, but the $32 level is going to present another challenge.
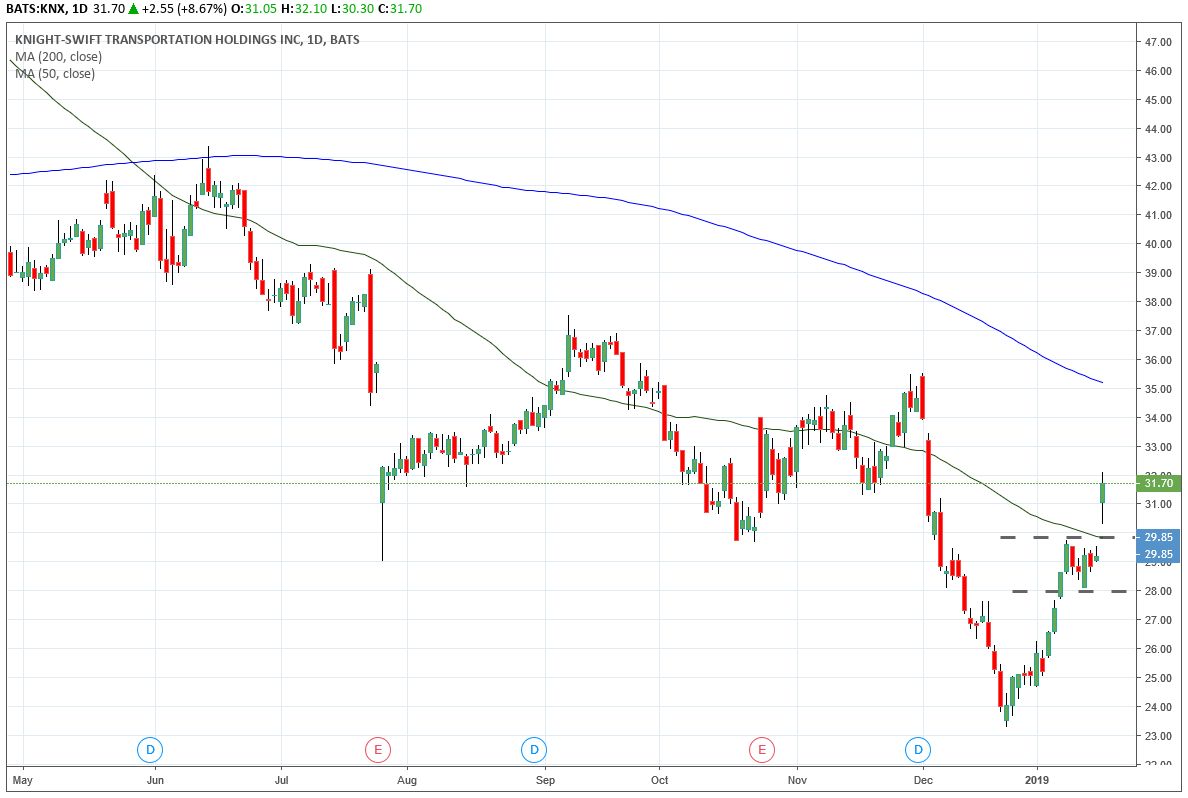
Daily Chart of Knight-Swift Transportation Holdings Inc. (KNX) — Chart Source: TradingView
If we make a bearish play on KNX now, we can take profits while other traders are stuck in declining long positions. For that reason, I recommend buying puts on KNX.
Buy to open the Knight-Swift Transportation Holdings Inc. (KNX) May 17th $25 Puts (KNX190517P00025000) at $0.80 or lower.
Follow our Facebook page to receive each Trade of the Day direct to your News Feed — and join the conversation.
InvestorPlace advisor Ken Trester brings you Power Options Weekly, which delivers 5 new options trades and his latest trading advice to you each Friday. Trester has been trading options since the first exchanges opened in 1973 with a winning streak that goes back to 1984 with money-doubling average annual profits since 1990.