Shares of industrial stocks as measured by the industrial sector of the S&P 500 have largely outperformed the S&P 500 itself since early January 2019. Within this sector, shares of Boeing (NYSE:BA) (the largest weighing) has not only led the rally but also aggressively pushed to fresh all time highs. BA stock now however looks to be exhausted on the upside for the time being and ripe for a so called “mean-reversion” move lower.

Before digging into the analysis of my current trade idea in BA stock allow me to remind you of the power of understanding and respecting the high positive correlation of stocks as an asset class. Even more, you should respect the positive correlation of stocks within any given sector or group or industry group of stocks. While not every single industrial stocks has rallied big since early January, the majority of them have seen considerable price appreciation. … i.e. “lifting with the tide.”
This same analysis can be applied when stocks, say, get overbought. In other words, currently as per my analysis, it is not just shares of Boeing that are overbought. Indeed the entire industrial sector of stocks is extended on the upside in the near term.
BA Stock Charts
Click to Enlarge
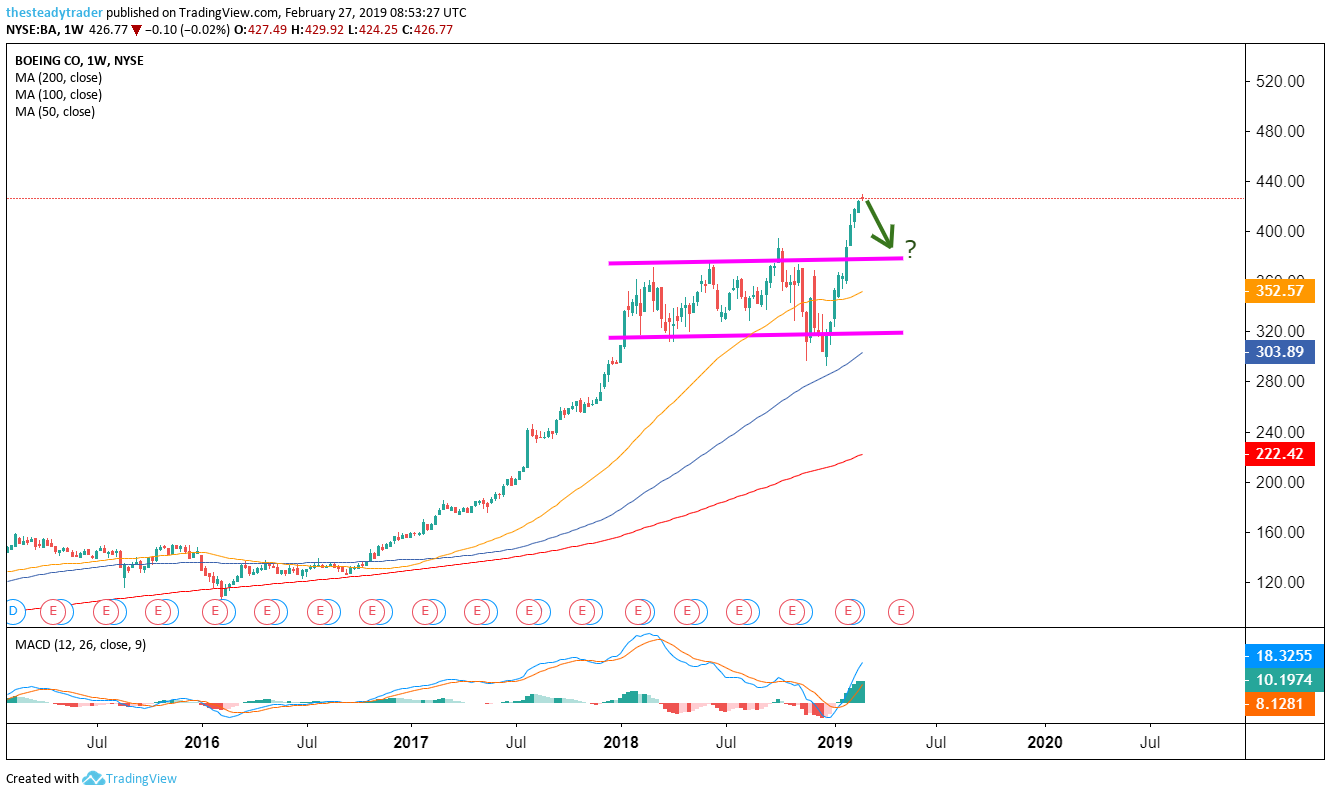
Moving averages legend: red – 200 week, blue – 100 week, yellow – 50 week
Let us start off the analysis with the big-picture multiyear chart of BA stock. From this angle we see that the stock had a notable and steady ascent from the autumn of 2016 into early 2018. While the stock saw plenty of gyrations in 2018 it largely trotted sideways. This sideways march while frustrating the momentum bulls did allow the stock to work off its overbought readings from early 2018.
After a swan dive in Q4 2018, along with the broader stock market, BA stock then also quickly got back on its feet in late December. The rally has been so aggressive since then that it took the stock from a marginal overshooting on the downside to a breakout on the upside, i.e. out of the sideways consolidation pattern marked by the two purple parallels.
A simple but classic principle of technical analysis is that when a breakout such as this one occurs, more often than not the breakout point is revisited in a mean-reversion move at least once. That is exactly what I foresee taking hold for BA stock in the near future.
Click to Enlarge
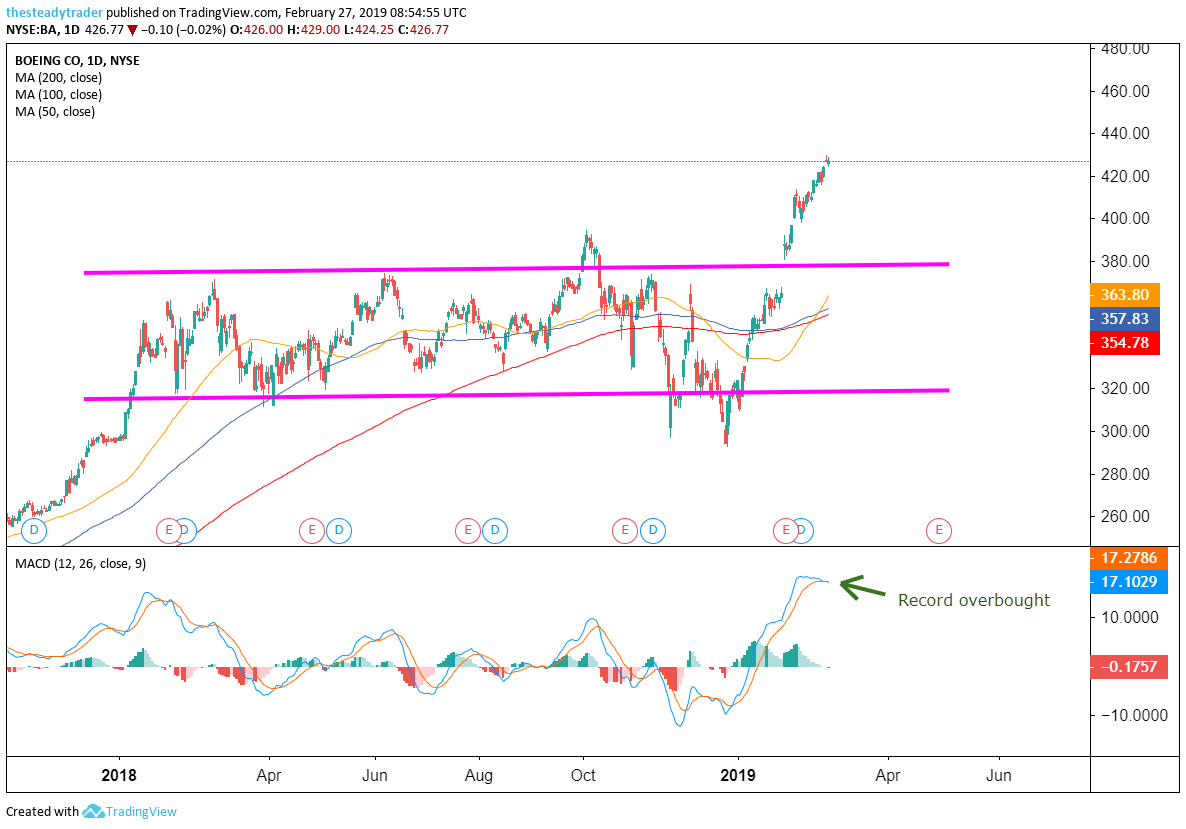
Moving averages legend: red – 200 day, blue – 100 day, yellow – 50 day
On the daily chart, we see that BA stock had an initial steep rally starting in late December 2018. This rally was topped with an up-tap and breakout move following the January earnings report. And the rally has continued since in near unabated fashion.
This now has the stock record overbought on the daily MACD momentum oscillator (bottom of chart) and in my eye begging for a pause and mean-reversion move lower back toward the $400 area.
Directional stock traders could look to enter a short position in the stock above $420 while options traders may consider doing the highest probability trade that I know of: the income trading strategy known as an options credit spread.
On Thursday, I am holding a special webinar for InvestorPlace readers to teach this strategy in detail. Register HERE for this free webinar.
Free webinar: How to 5X your returns in 2019. Register HERE.