Shares of PayPal (NASDAQ:PYPL) stock, like the broader market, have rallied sharply off the late December 2018 lows. Unlike the broader market, though, this stock is breaking to fresh all-time highs and looks to continue its upside trajectory.
As much as the stock market as a whole has largely traded in tandem over the past few months, i.e. up-days saw most stocks lift while down-days saw most stocks sell off, as I look deeper into 2019 I think this will be much more or a stock picker’s market. Yes, we will see awesome and tradeable swings in the broader stock indices in 2019 I believe, but we will also see more separation between stocks that are in true growth phases versus others that are more exposed to the business cycle.
Online payment systems such as those services that PayPal provide, in my eye, remain in a raging bull market from a business perspective. While a general economic slowdown will ultimately affect just about every corner of the economy, stocks in a true industry growth phases should at the margin weather an economic slowdown better than most stocks.
PYPL Stock Charts
Click to Enlarge
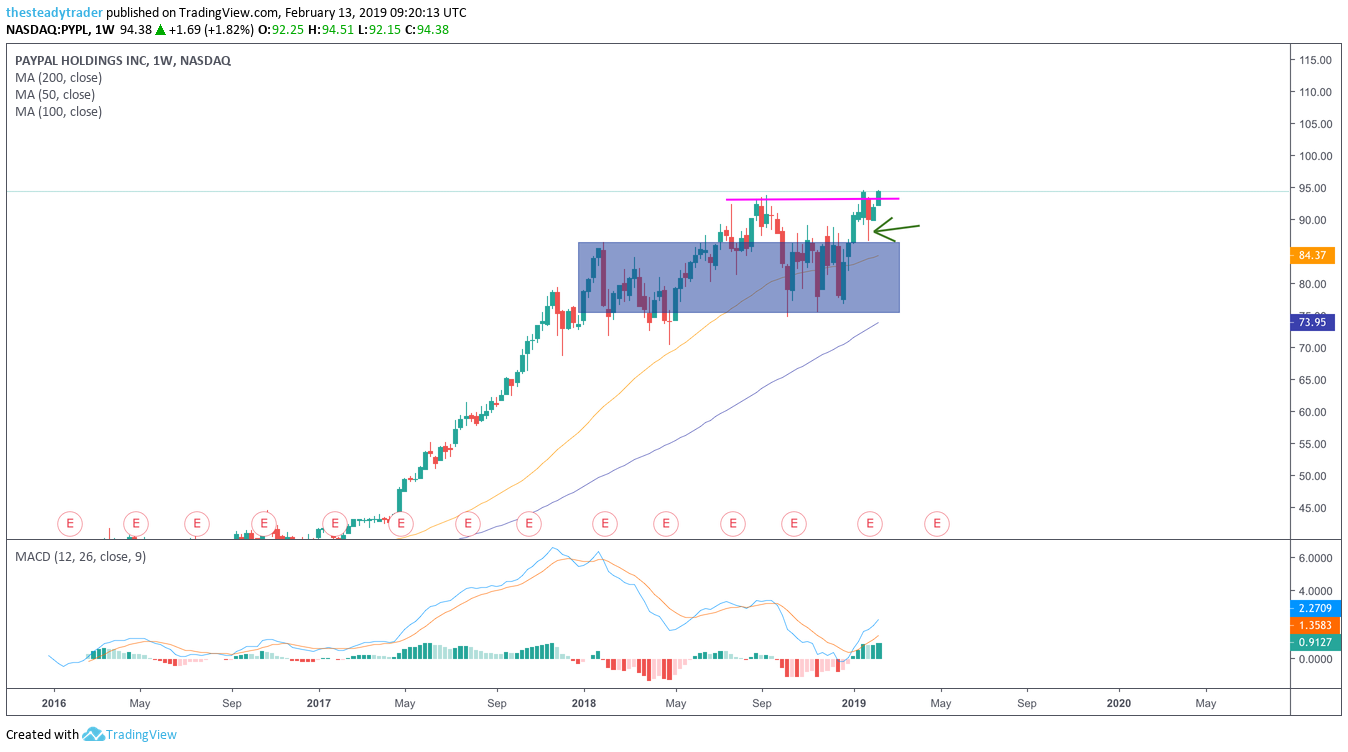
Moving averages legend: red – 200 week, blue – 100 week, yellow – 50 week
For some perspective, let’s head over to the charts, starting off with a multiyear look at PYPL stock. Here we see that although the stock has seen a sharp rally of late, it really hasn’t done much since July of 2018, directionally speaking. In fact, the stock has largely oscillated back and forth, likely frustrating most “breakout chart-chasers” to the point where they have now given up.
In fact, one could go back as far as early 2018 and say that PYPL stock has mostly consolidated sideways since then. Given the recent rally, however, to yours truly the odds of a break higher are now better than they have been in the past year or so for this name.
Click to Enlarge
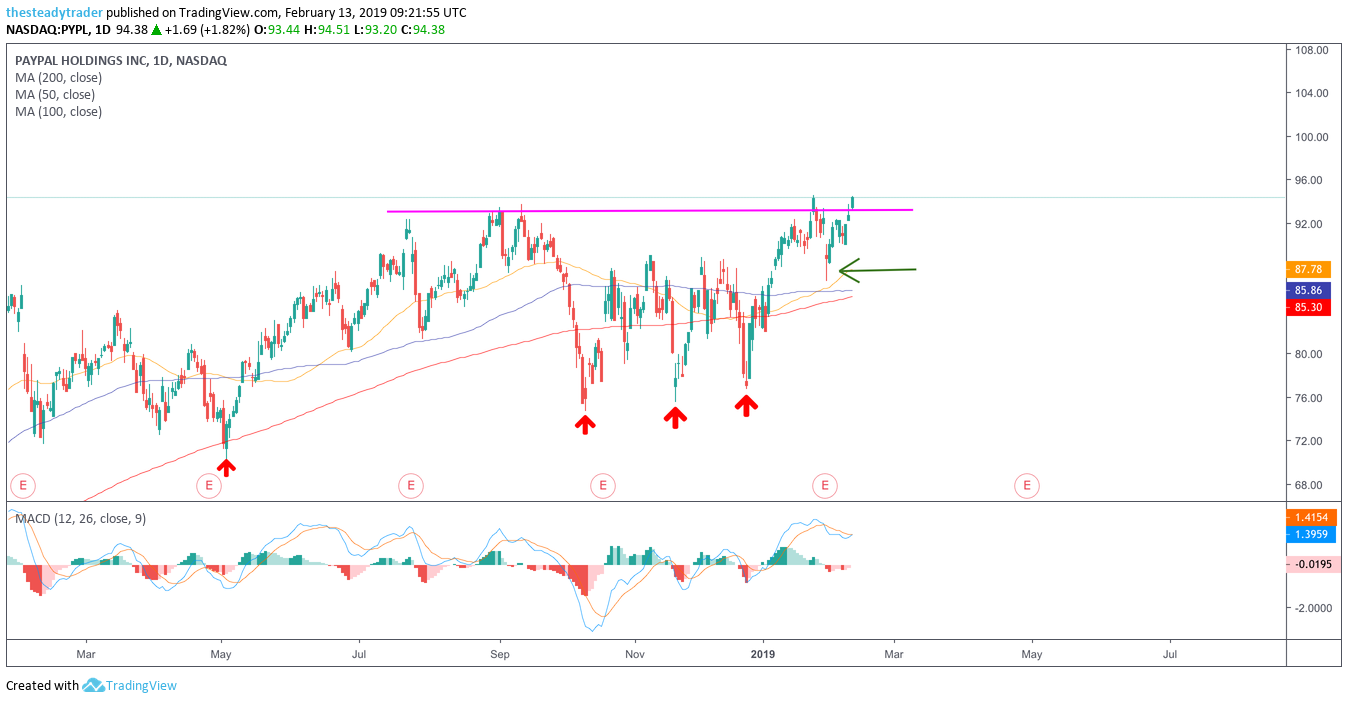
Moving averages legend: red – 200 day, blue – 100 day, yellow – 50 day
On the daily chart, we see that despite the choppy going, PYPL stock has since May 2018 made a series of higher lows — see the red arrows on the chart. On Jan. 31, the stock dropped after its earnings report but quickly flashed exhaustion selling and a few days later my proprietary indicator signaled a B2 Reversal buy.
On Feb. 12, my indicators flashed another buy signal with a next upside target at $100. Any strong bearish reversal on a daily closing basis would be a stop loss from a swing trading perspective.
Get FREE ACCESS to Serge’s renowned Stock Market Scanner with actionable trade ideas. Get it HERE.