Shares of Starbucks (NASDAQ:SBUX) had a good 2018, had a good run already in 2019, broken to new highs and all the chart dudes are liking it. While I fundamentally like the company through the longer term, in the near-term SBUX stock is awfully overbought and active investors and traders may look to “fade” the most recent pop in the stock.

.jpg)
The concept of mean-reversion in financial markets is, in my eye, not often enough discussed or respected. In fact, mean-reversion tends to happen when investors and traders least expect it. For a recent example, check out the mean-reversion move lower in stocks in October 2019, or mean-reversion higher that began in late December 2018. In fact mean-reversion is just what happens when positioning is getting extreme in either direction.
In the case of extreme near-term bullishness, mean-reversion lower takes hold as buyers exhaust themselves, i.e. no more buyers left means the stock in question at the very least will have to move sideways (or lower) until new buyers emerge.
SBUX Stock Chart
Click to Enlarge
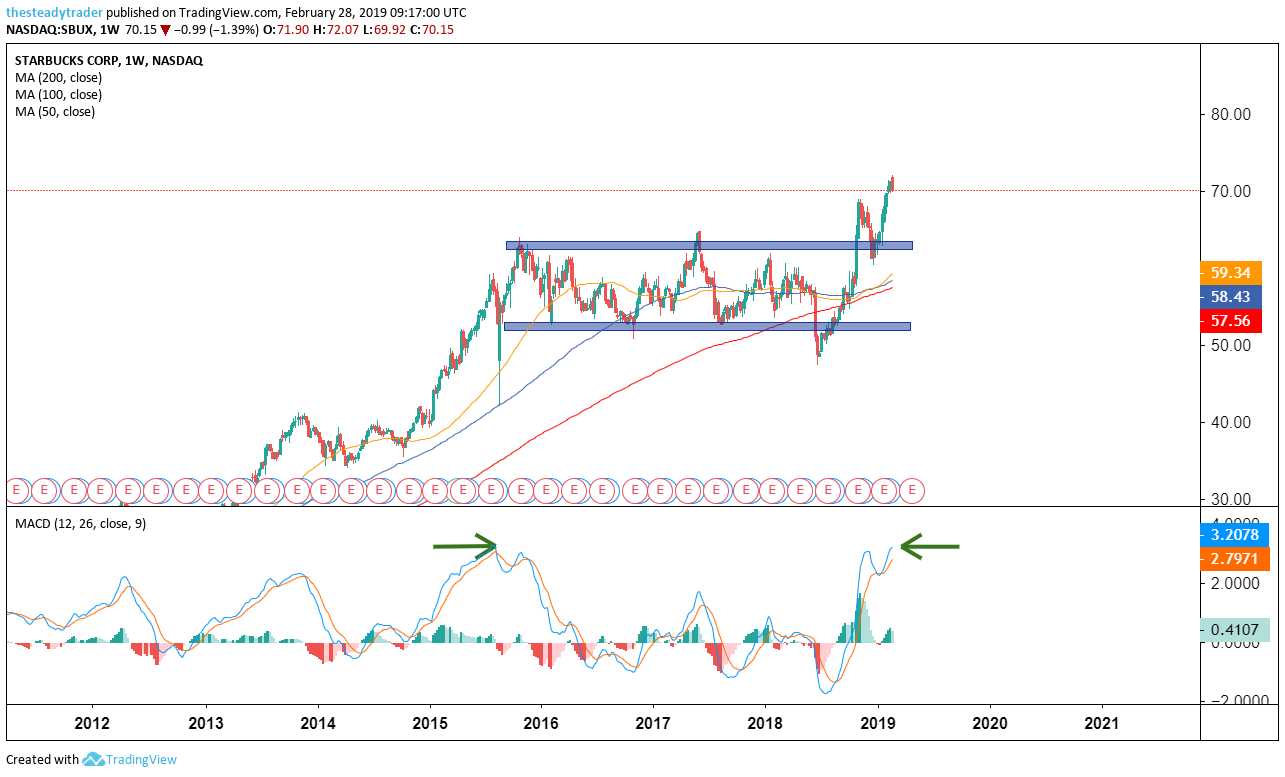
Moving averages legend: red – 200 week, blue – 100 week, yellow – 50 week
Looking at the multiyear weekly chart, we see that SBUX stock largely moved sideways from late 2015 into October 2018, where it broke out of the range. While the stock in late 2018 pulled back to the previous upper end of the trading range, the most recent broad-based stock market rally allowed the stock to climb higher again.
From a momentum perspective the stock now on the weekly chart and as per the MACD momentum oscillator at the bottom is more overbought than it was in the second half of 2015, before the stock corrected. At the very least from this angle this stock in my eye is not one to chase higher at this juncture.
Click to Enlarge
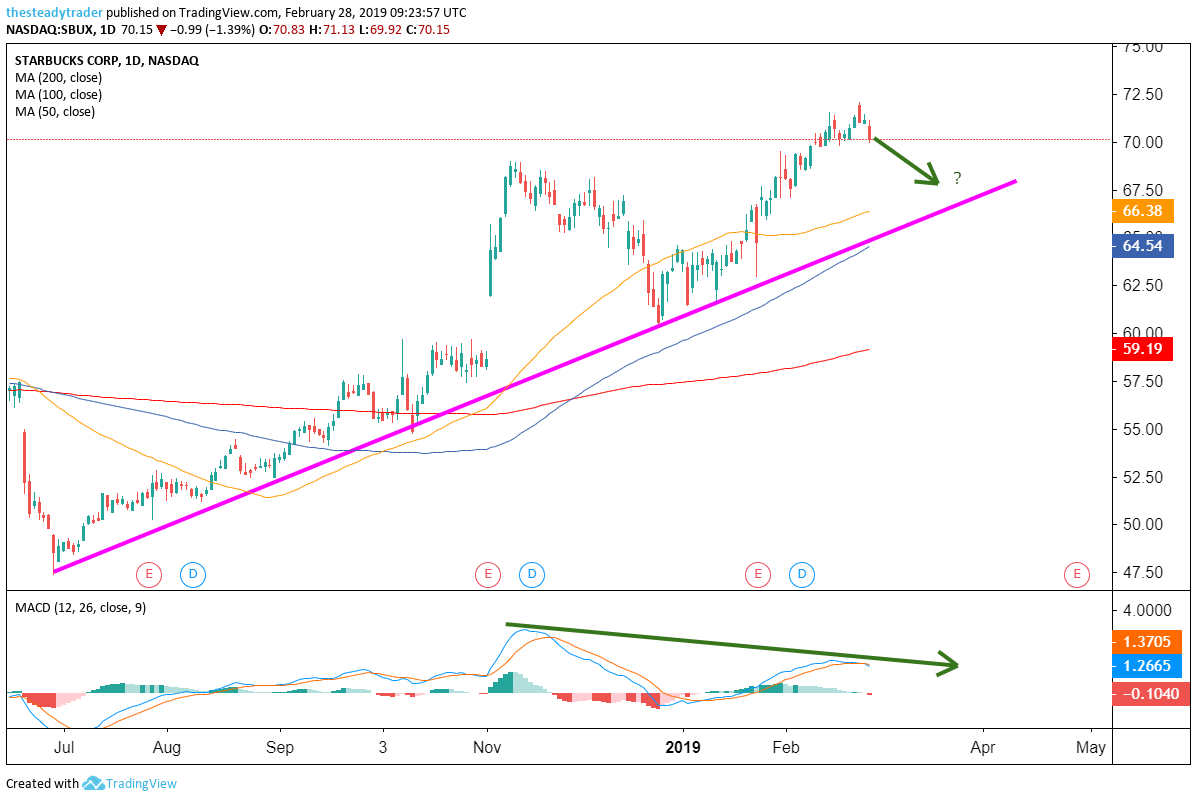
Moving averages legend: red – 200 day, blue – 100 day, yellow – 50 day
On the daily chart we see that SBUX stock gave us initial buyer exhaustion on Feb. 25 followed by follow-through, i.e. confirmation selling on Feb. 27. From a momentum perspective note that the daily MACD peaked in November of 2018 and is now diverging (lower high) from price, which earlier this week made a higher high. This type of negative divergence often results in momentum being the correct indicator of what is soon to come for the price, i.e. lower.
A well-defined next downside target could be in the high $60s, which is where the up-trend line from summer 2018 comes in.
Directional traders may look to short SBUX stock north of $70 with a next downside target in the $67-$68 range. Alternatively, those traders looking to put on a higher probability trade may open a so called “bear call” options spread trade, which is the highest probability trade (if structured properly) in this situation in my experience.
Today, I am holding a special webinar for InvestorPlace readers to teach this strategy in detail. Register HERE for this free webinar.
Free webinar: How to 5X your returns in 2019. Register HERE.