Apple (NASDAQ:AAPL) stock over the past couple of weeks accelerated its year-to-date rally and, through the lens of technical analysis, pushed into a critical area of “confluence resistance.” The path of least resistance in the near term looks to be sideways to lower for AAPL stock.
I always preach the importance of multi-time-frame analysis for any trading and investing setup. This is particularly important when it comes to stocks such as Apple, where there is a daily flood of news and rumors. The propensity to get sidetracked by sensationalism in such stocks, and thus lose sight of the bigger picture, is above average.
Now, let’s move on to the analysis of this particular setup I am eyeing at the moment.
AAPL Stock Charts

Click to Enlarge
Moving averages legend: red – 200 week, blue – 100 week, yellow – 50 week
On Monday, Apple announced a series of new services, which market participants seem to have front-run over the past two weeks by bidding the stock higher.
For some perspective, let’s first look at the multi-year weekly chart, where we see that AAPL stock over the years has largely ascended inside a well-defined up-trending channel. In May 2018, however, the stock began a notable and meaningful overshooting rally out of said channel. As gravity tends to work as well in the stock marked as it does in the physical world, by the autumn of 2018 the stock began to mean-revert not only back into the channel but straight to the lower end of the channel.
The rally that ensued from late December 2018 into as recent as a few days ago has pushed the stock right back to the upper end of the channel. From this angle the stock should for the near term find some technical resistance and at least back and forth for a while.
Click to Enlarge
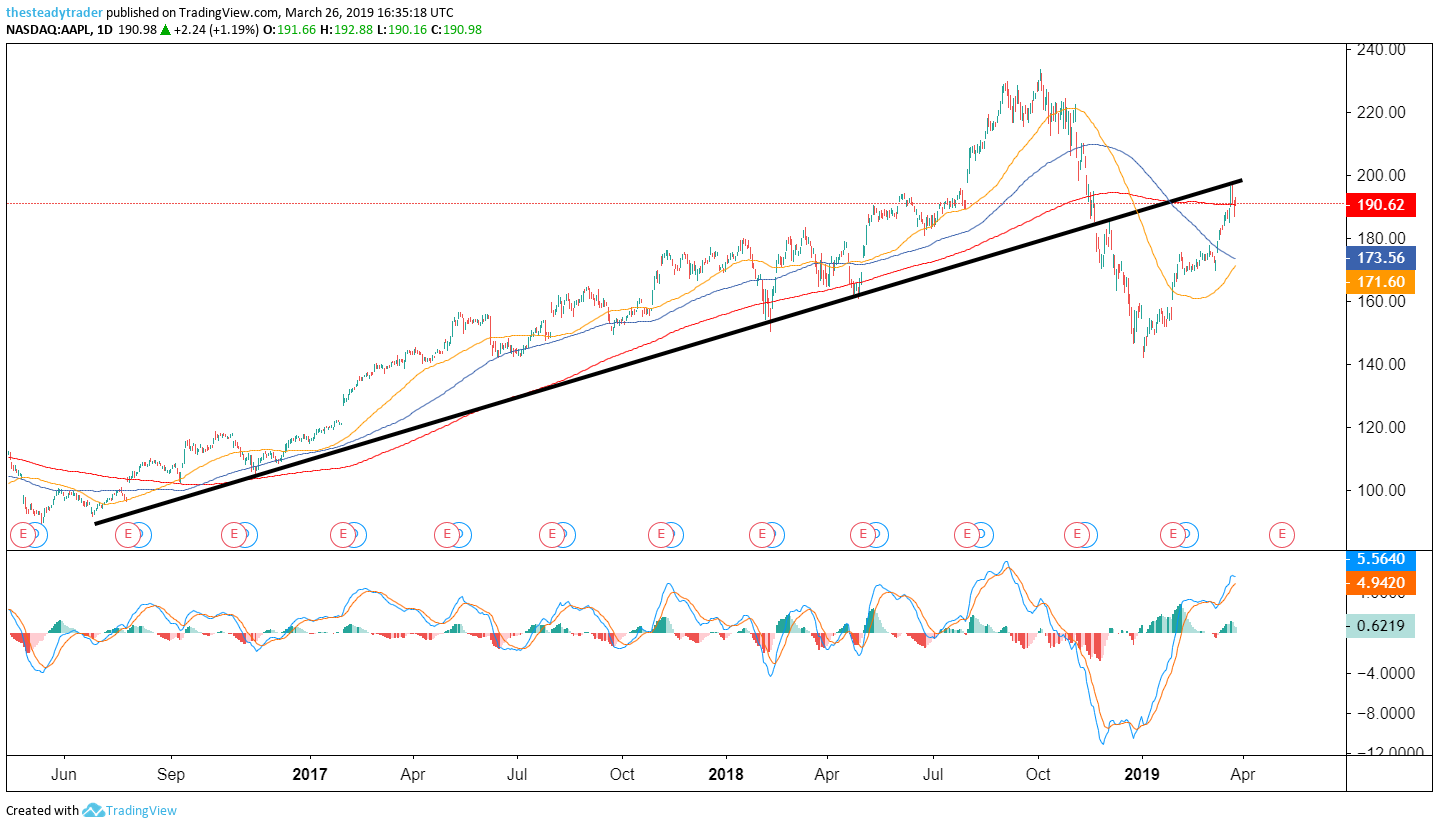
Moving averages legend: red – 200 day, blue – 100 day, yellow – 50 day
On the daily chart, we see that the year-to-date rally has also pushed the stock back up to a line of former support that could now begin to act as resistance. Also note that the red 200-day simple moving average is also coming into play as potential resistance here at current juncture and that the $200 area may have served as an attraction level for the stock gravitate higher to.
Lastly, at the bottom of the chart we see that from a momentum perspective as measured by the MACD momentum oscillator, the last time AAPL stock was this near-term overbought it was September 2018.
Given all of the above, I see the stock capped on the upside for the near term and range-bound with in the zone of $200 on the upside and maybe $175 on the downside. Directional traders could look to play AAPL stock from the short side toward $175 while any break and hold above the $200 area would serve as a last resort stop loss.
My absolute favorite strategy in a situation such as that of AAPL stock at this point is to sell a so-called out-of-the-money options call spread in a very particular way, in order to generate steady income for the portfolio.
On Friday I am holding a special webinar for InvestorPlace readers where I will explain this strategy in detail. Click here to register.
Special webinar this Friday: Maximum Income from the options market. Register HERE.