Stocks have been taking a little breather over the past few trading days, digesting the massive year-to-date rally. The important financial sector of the S&P 500 as represented by the Financial Select Sector SPDR Fund (NYSEARCA:XLF) flashed near-term sell signals two days ago and I still see further downside for a trade in the XLF ETF.
Over the years as a professional trader, I have learned that taking “idiosyncratic” risk on single name stocks is not always the best choice from a reward to risk perspective. In fact I have increasingly found that using a sector or group ETF to express a view is simply a better bet if ones focus is risk management as opposed to reward chasing.
Along with technology and one or two other sectors, the financial sector is one of the most important ones to get right if one wants to get the broader market’s trends right.
XLF ETF Charts
Click to Enlarge
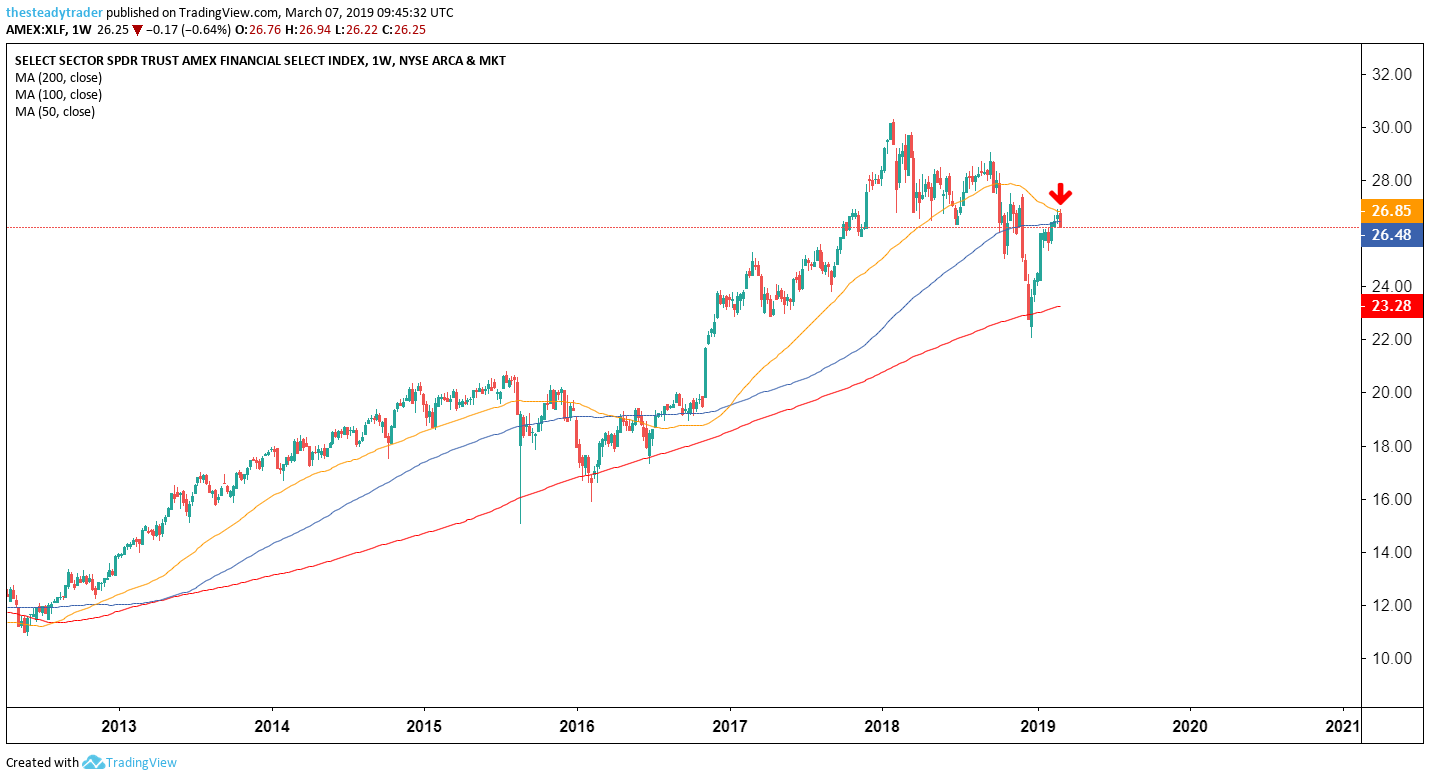
Moving averages legend: red – 200 week, blue – 100 week, yellow – 50 week
In that vein, starting with the multi-year weekly chart we see that along the way the red 200-week simple moving average has been a good support reference point. This once again held true in late December 2018 where the XLF bounced from meaningfully.
Another notable reference point, however, has been the yellow 50-week moving average, where this sector ETF has now rallied up to. A failure here would lead to another lower high … of which we have already seen two since early 2018.
Click to Enlarge
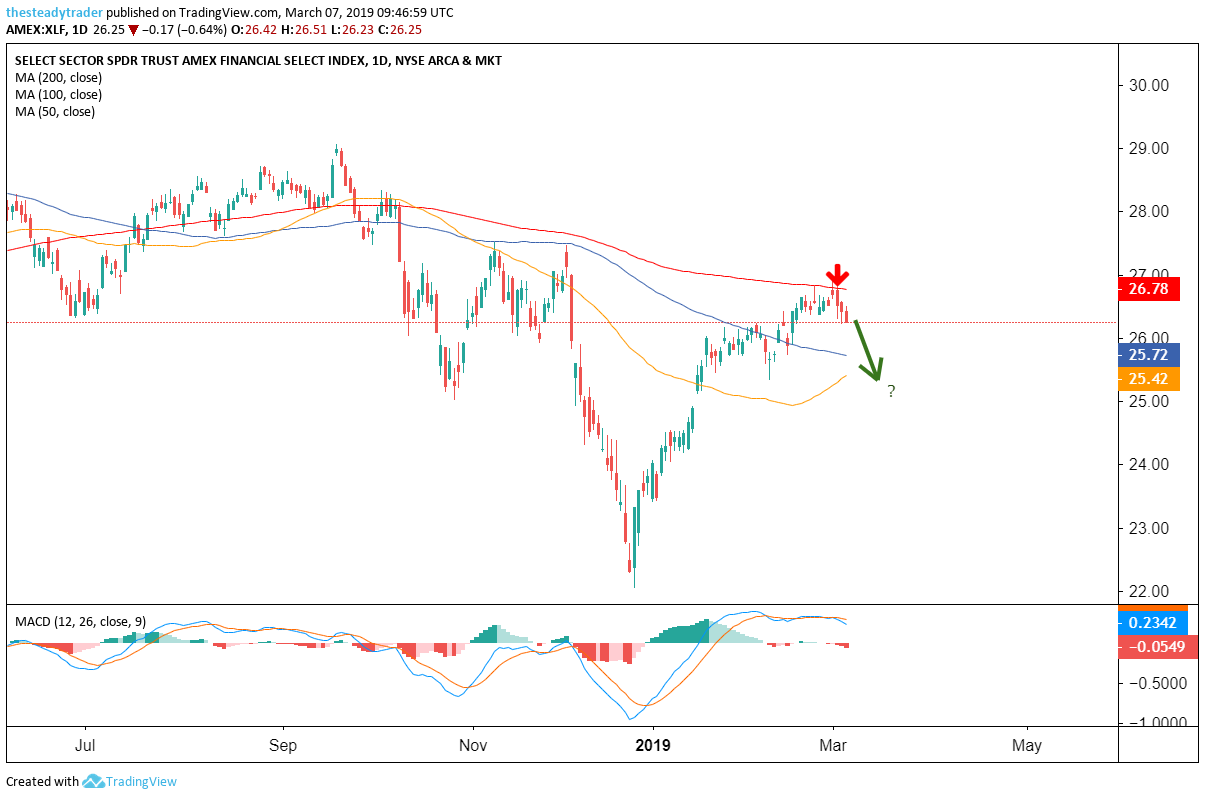
Moving averages legend: red – 200 day, blue – 100 day, yellow – 50 day
On the daily chart we see that the red line here is the 200-day simple moving average (roughly equal to the yellow 50-week moving average from the above chart). Note that earlier this week this moving average was rejected in a textbook way and we have seen the important follow-through selling confirmation over the past two days.
In fact, the most recent bearish reversal in the XLF ETF has followed a specific high probability candlestick pattern that I scan for each day. On Thursday I am holding a special webinar for InvestorPlace readers to teach this pattern in detail. Register HERE to join the free webinar.
From here active investors and traders have a very well defined last resort stop loss on any short-side trades they attempt in the financials ETF, namely the red 200-day moving average, currently around the $26.80 mark.
A next downside profit target is around the $25.50 area.
Alternatively, options traders could look to buy put spreads using at the money options expiring no less than 50 days out, as implied volatile is still relatively cheap.
The one candlestick pattern that will change your year. Free webinar. Register HERE.