As government bond yields have continued to move lower in recent weeks, the chase for yield has accelerated. One area in which this is notable is utilities stocks, as represented by the Utilities Select Sector SPDR ETF (NYSARCA:XLU). However, this part of the market is now looking increasingly overbought and ripe for a pause or mean-reversion move lower. With that in mind, let’s take a look at how to play the XLU ETF today.

When it comes to utilities as a sector of stocks, I often hear people discuss how this is a defensive sector and one to “hide in” when the broader stock market is in trouble. While that can be true sometimes, I find this to be a dangerous generalization and oversimplification of the true dynamics behind what drives utilities stocks and bond prices for that matter.
Case in point: Lately the broader stock market has gyrated and is now just about to break to fresh all-time highs again … yet bonds and utility stocks have also seen a persistent bid. In other words, much of the recent rally in utility stocks was arguably more a factor of yield-searching investors buying dividend-paying utilities than it was an ominous sign for a big stock market meltdown … at least so far.
XLU ETF Charts
Click to Enlarge
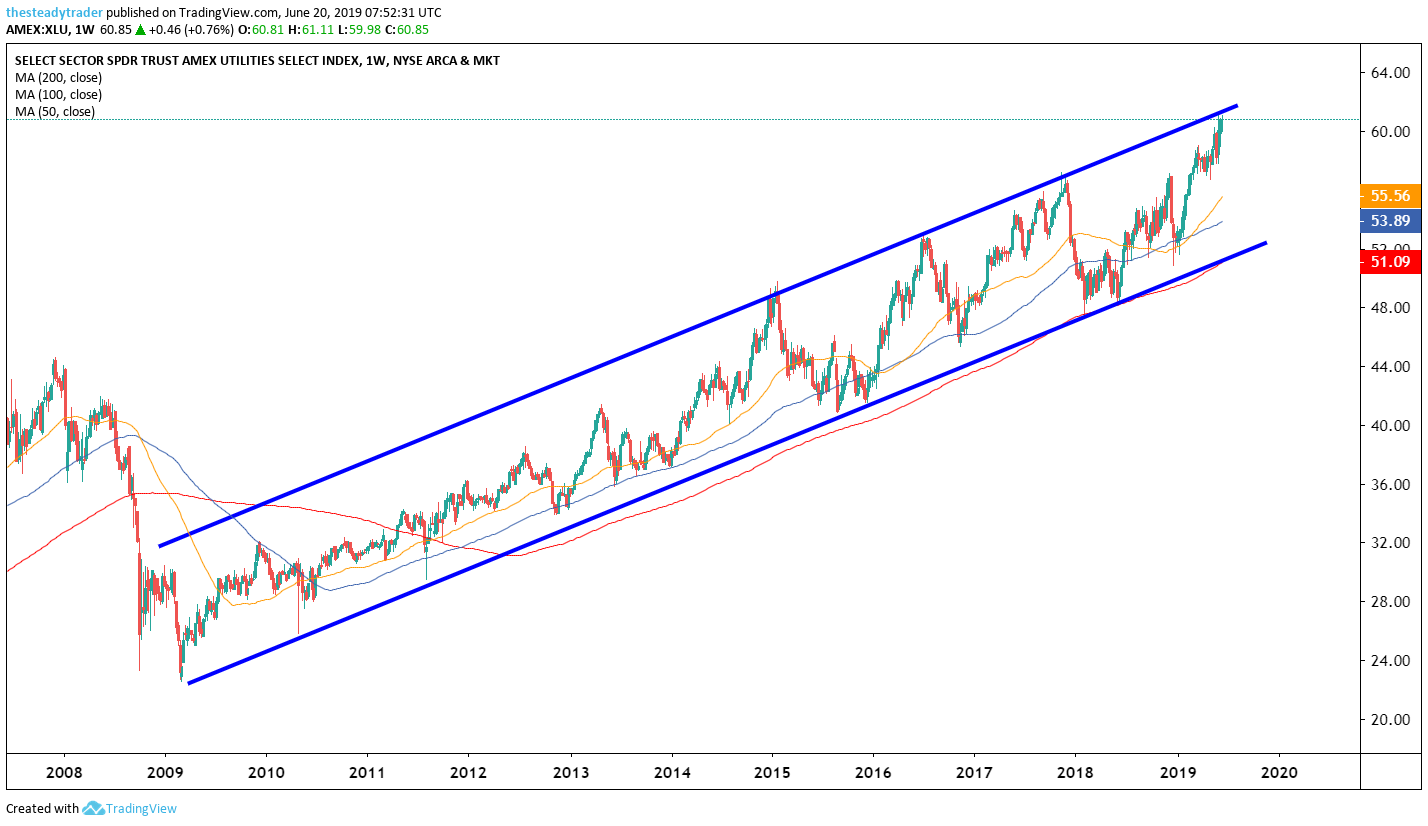
Looking at the multi-year weekly chart we see that as a result of the year-to-date rally, the XLU ETF has once again reached the very upper end of its 10-year upward-sloping channel. The simple question to ask oneself here is whether it’s worth fighting this chart, i.e., betting on a breakout higher. To me, the answer is clear.
No.
While I am not calling for a collapse of utilities stocks here, I do think upside in the near-term is capped and a sideways-to-lower move is ahead, when you consider it through the lens of healthy price consolidation.
Click to Enlarge
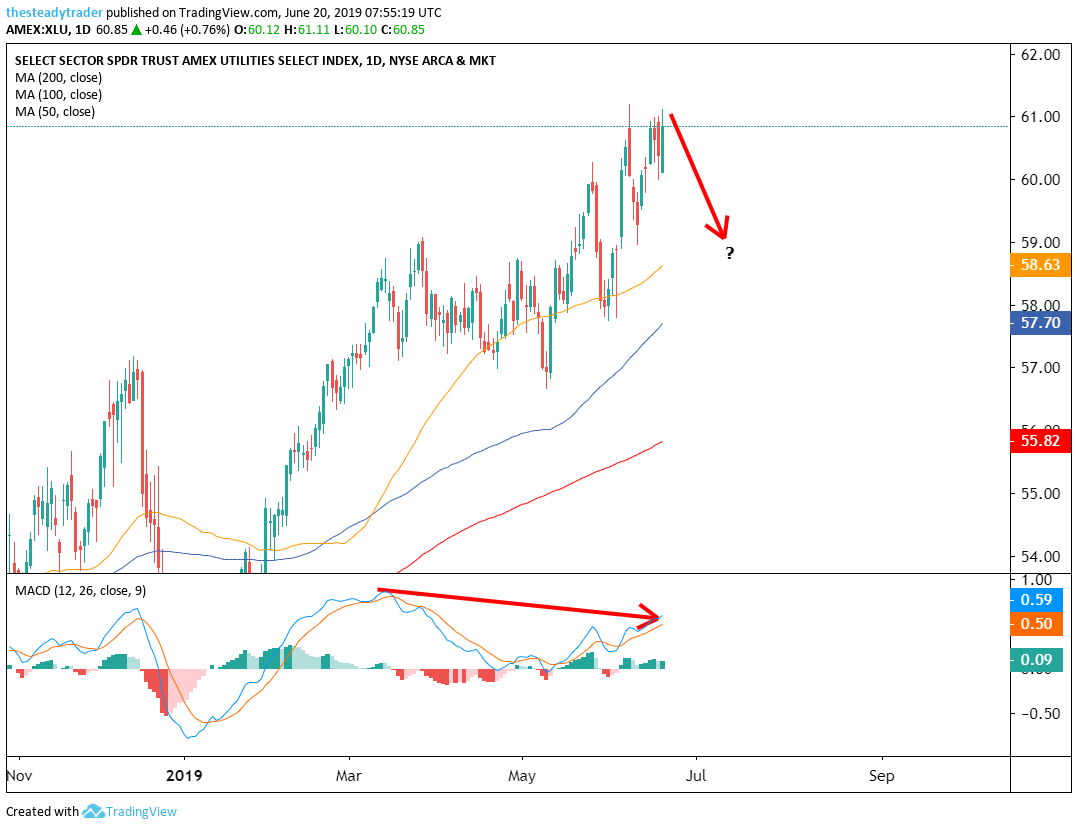
On the daily chart, a couple of things stand out that also confirm the overbought readings of the above weekly chart:
- The recent rally in the XLU ETF has thus far not been met with a new high in momentum. This is shown by the MACD momentum oscillator at the bottom of the chart, which printed a high in March but since then has not yet made a new high or matched the highs from March. If you consider investor psychology for a moment, this may mean that buyers are exhausted in the near term.
- The price area around $61 has offered overhead resistance since early June and while this does not mean a marginal overshooting move to the upside can’t take place, this area does coincide with the very upper-end of the aforementioned multi-year trading range on the weekly chart.
Simply put, active investors and traders at this juncture and around the $61 area could look to sell or short the XLU ETF with a downside target at $58.50.
Any fresh bullish reversal from here would be a stop loss signal. Options traders could look to buy an at-the-money put or put spread using September options.
Get FREE ACCESS to Serge’s renowned Stock Market Scanner with actionable trade ideas. Get it HERE.