The SPDR S&P 500 ETF (NYSEARCA:SPY) is still higher by about 20% for the year-to-date. While one must continue to respect this up-trending market, in the near term a flurry of risk may push the index into a consolidation period. Active investors and traders could look to short the SPY ETF or buy puts or at the money put spreads.

As I often indicate, so-called “single factor models,” where one makes a trading or investing decision based on a single fundamental or technical factor, don’t stand much chance of success over time. The more things (fundamental, technical or structural) that line up at any given point, the better the trade setup … or at least the better one can define risk.
The current juncture in markets is interesting. The Federal Reserve just lowered interest rates for the first time in years. Defensively oriented stocks and asset classes continue their YTD bid. Economic activity continues to slow; tech earnings growth is slowing considerably. And we are heading into the typically binary month of August.
Binary? What do I mean?
August has a strong tendency to either be a real snooze for investors as risk assets just side-step around, but August can also be a hugely volatile market. That’s it, however … there is nothing in between. Given this tendency and the juncture we are at, as I lay out also on the below charts, I see the opportunity to put on some short side trades in the SPY ETF.
SPY ETF Charts
Click to Enlarge
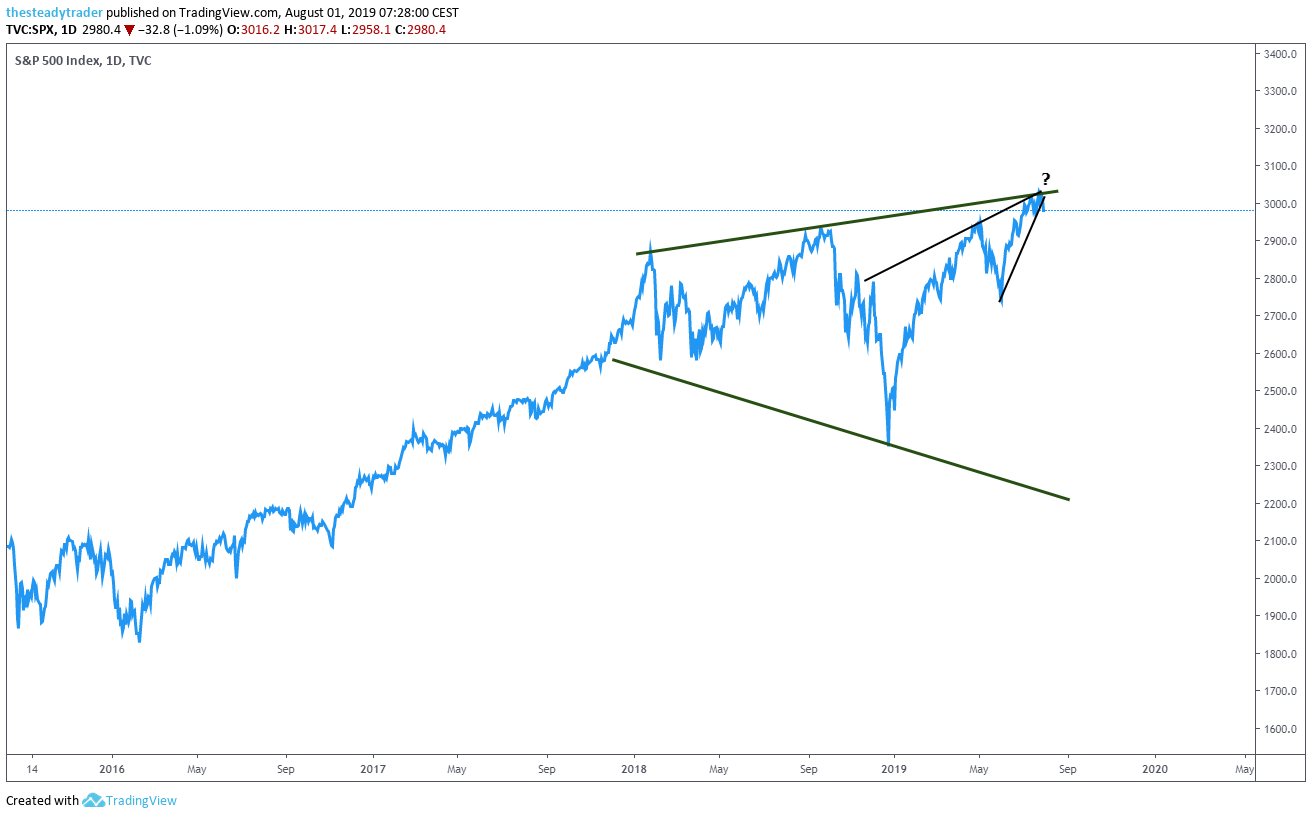
The S&P 500 for its part in recent weeks pushed above the psychologically critical 3,000 area. This area, just north of 3000, also coincides with the upper end of the large “megaphone” pattern highlighted by the two green lines, which in the past also offered resistance.
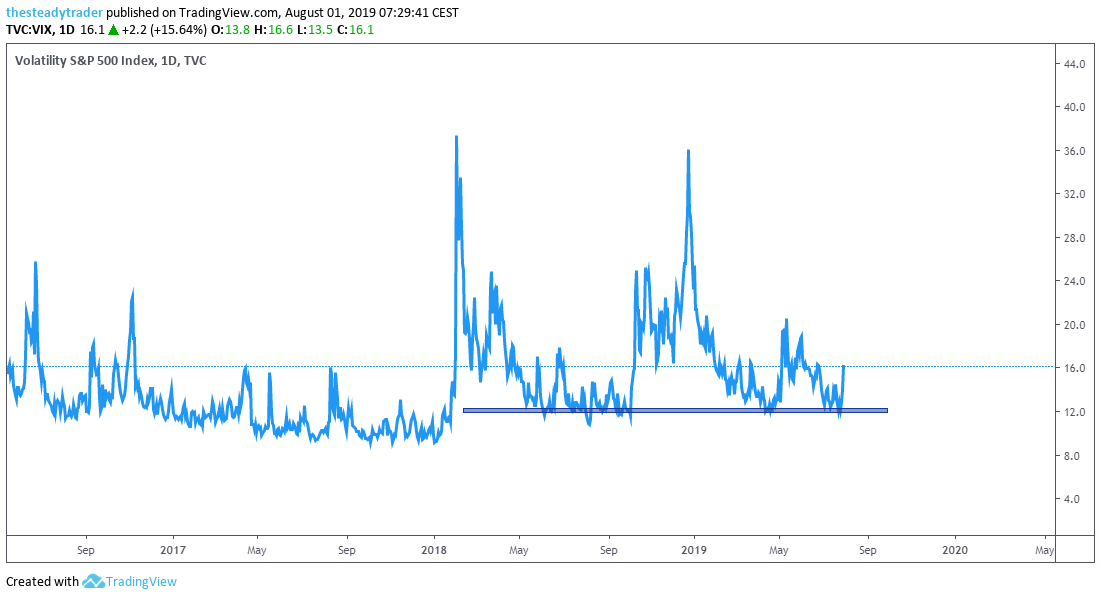
The VIX, which measures options implied volatility in the S&P 500 has risen in recent days but still looks like it has further mean-reversion potential to the upside, which would likely indicate that stocks have more mean-reversion potential to the downside.
Click to Enlarge
On the close-up chart of the SPY ETF that represents the S&P 500 index, we see the most recent rising wedge pattern (red lines) that formed and on July 31 was marginally broken. This break also resulted in the SPY ETF holding below its yellow 21-day simple moving average for the first time since early June. To me, the path of least resistance points lower in the SPY, for a trade.

Click to Enlarge
Active investors and traders could look to short the SPY around the $298 – $300 area with a first downside target at $288. Any strong bullish reversal is a stop loss signal.
Alternatively, one could purchase the October $300 – $290 bear put spread.
Get FREE ACCESS to Serge’s renowned Stock Market Scanner with actionable trade ideas. Get it HERE.