Fellow Trader,
It’s been a choppy week for the U.S. markets as new developments in the ongoing trade war have whipsawed stocks.
Last week, the markets tumbled after China devalued its currency, the yuan. Since then, we’ve seen a bit of a bounce, but the bulls are looking weak.
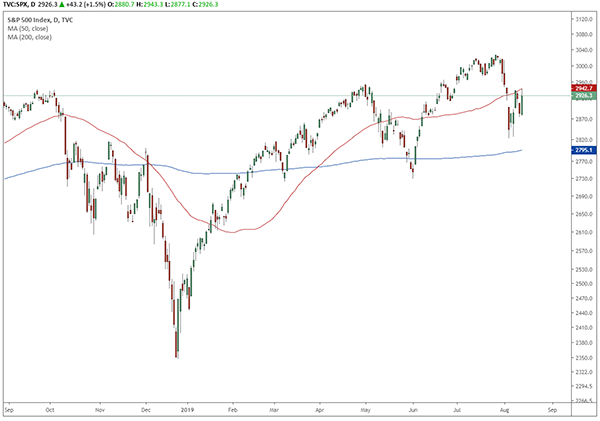
Daily Chart of S&P 500 Index (SPX) — Chart Source: TradingView
You can see in the chart above that the S&P 500 index is still below its 50-day moving average (red line). While it has tested that level from the underside several times during the past few trading sessions, it has failed to break decisively above that level.
As my regular readers know, moving averages can be long term or short term in nature. Traders typically look at 50-day and 200-day moving averages for clues about market direction, as they help to smooth out the day-to-day volatility in the market.
The major indices jumped more than 1% yesterday when the Trump administration announced that it would delay the latest round of tariffs until mid-December. However, even with that positive development, the S&P could not break through its 50-day moving average at 2,942.
I’m also seeing some bearish warning signs from one of my favorite indicators — the S&P 500 Volatility Index (VIX), otherwise known as Wall Street’s fear gauge.
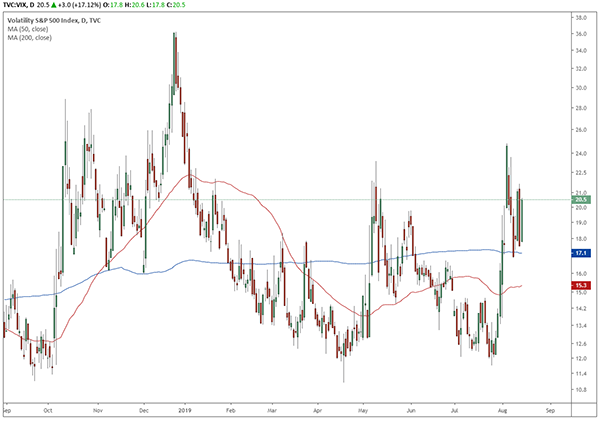
Daily Chart of S&P 500 Volatility Index (VIX) — Chart Source: TradingView
As you can in the chart above, the VIX crossed above both its 50-day and 200-day moving averages last week during the market’s downturn and has held above both of those levels since then.
Anytime the VIX crosses above the 17 level, that’s when I start to get more defensive. Right now, the VIX is sitting just above 20, which tells me that market participants are expecting further weakness in stocks.
If the VIX stays elevated at these levels, I wouldn’t be surprised to see the S&P fall further and test its 200-day moving average at 2,795. Whether that level holds will tell us a lot more about what the next move for the market could be, so we’ll have to wait and see.
Meanwhile, all of this volatility has continued to boost precious metals. Gold and silver, as you can see in the chart below, are making further gains this morning as stocks fall again.
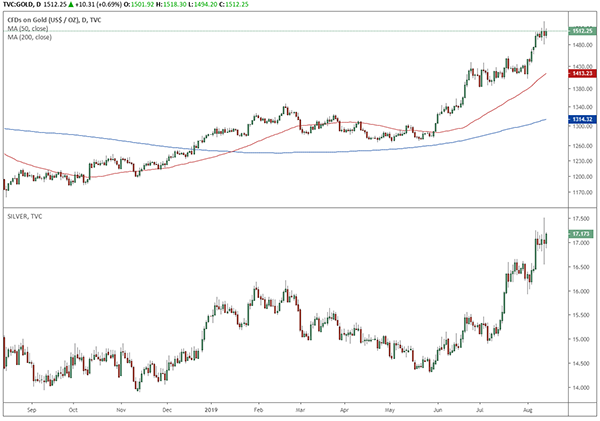
Daily Chart of Gold and Silver — Chart Source: TradingView
I’ve said before that I expect silver to catch up to the rally in gold, and I still believe that will be the case.
Gold is up about 18% for the year to date, while silver is only up 11% over the same time period. Silver is hitting some resistance near $17.50 per ounce, but if it can break above that level, I’d expect it to rally even further.
With that in mind, I’m recommending a bullish call debit spread on iShares Silver Trust
(NYSEARCA:SLV), the exchange-traded fund that seeks to reflect generally the price performance of silver.
Using a spread order, buy to open the SLV Oct. 18th $16 call and sell to open the SLV Oct. 18th $17.50 call for a net debit of about $0.37.
Note: Be sure you are opening the monthly SLV options that expire on Friday, Oct. 18, 2019.
About Debit Spreads
A debit spread is simply a way to lower the cost of buying options, as the option that you sell to open (short) helps offset the cost of the option that you buy to open. Therefore, this call debit spread is a way to lower the cost of buying bullish call options. Many brokers will require the use of margin and/or a set amount of reserved capital to execute a debit spread; contact your broker directly for specific requirements.
To receive further updates on this trade, as well as an alert when it’s time to take profits, sign up for a risk-free trial of Maximum Options today.