My indicators are giving bullish readings for the second week in a row, and I think a bullish trade on Citigroup, Inc. (NYSE:C) is the perfect way to take advantage.
While I do still have some concerns about the situation with China, there are a number of factors that have put me solidly in the bullish camp this week.
First and foremost, one of the main indicators that I look at on a weekly basis is participation, or market breadth. This is the ratio of stocks making gains to those posting losses.
I also look at the number of stocks that are trading above their 50-day moving averages and the number of stocks that are hitting new highs.
The S&P 500 index continues to make new highs on an almost daily basis. While that seems to be making some market pundits worried, I’m getting confirmation of the bullish trend from all of the breadth indicators I look at.
The financial sector has been performing particularly well, and C is getting close to its early 2018 high just above $80. I think the stock has room to run.
What’s Been Pushing the Financial Sector Higher?
If you look at the chart below, you can see that the Financial Select Sector SPDR Fund (NYSEARCA:XLF), which tracks the S&P 500’s financial sector, has been pushing further and further above resistance since October.
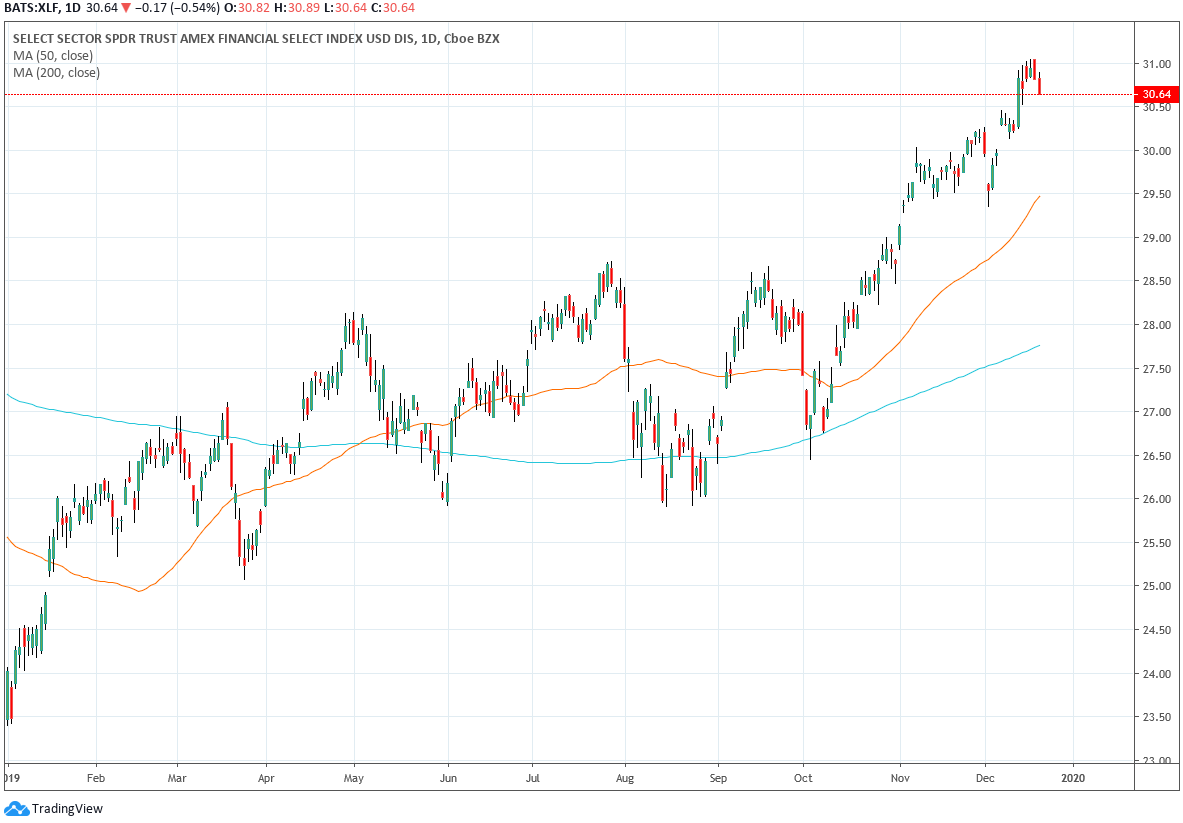
Daily Chart of Financial Select Sector SPDR Fund (XLF) — Chart Source: TradingView
This could be XLF’s best year since 2013, but why?
Long-term interest rates are rising, but short-term interest rates are low. The Federal Reserve cut the target overnight rate three times this year, and now, toward the end of the year, long-term rates have started bouncing back.
That means banks can earn more money from their loans. Regular Trade of the Day readers know that
net interest margin is the difference between the interest banks pay to lenders and the interest they receive from the people and institutions repaying loans. It also happens to be one of the main sources of a bank’s profits, and now it is going up.
How High can C go?
When C reported earnings last quarter, it beat earnings per share and revenue expectations. The company hasn’t had a negative earnings surprise since the fourth quarter of 2014, so its strong showing isn’t much of a shock.
But if you look at the stock’s chart below, you can see that after its last earnings report, the stock started a push higher that finally took it above up-trending resistance.

Daily Chart of Citigroup, Inc. (C) — Chart Source: TradingView
The last time the stock was this high was in early 2018. It could encounter resistance at its current level and pull back, but if it continues its push higher. I think it will reach for the $80 level, which is near its 2018 high.
Buy to open the Citigroup Inc. (C) March 20th (2020) $82.50 Calls (C200320C00082500) at $1.50 or lower.
To receive further updates on this trade, as well as an alert when it’s time to take profits, sign up for a risk-free trial of Power Options Weekly today.
InvestorPlace advisor Ken Trester brings you Power Options Weekly, which delivers 5 new options trades and his latest trading advice to you each Friday. Trester has been trading options since the first exchanges opened in 1973 with a winning streak that goes back to 1984 with money-doubling average annual profits since 1990.