Small-cap stocks as represented by the iShares Russell 2000 ETF (NYSEARCA:IWM), despite the recent sharp multi-week rally, remain down 30% from the January highs. The IWM ETF has been a relative underperformer versus larger-cap ETFs for a long time now. It doesn’t look like that’s going to change.

Even though correlation among stocks as an asset class is positive, it is crucial to note when one sector or classification of stocks is showing persistent relative strength or relative weakness. Such is and has been the case of small-cap stocks versus large-cap stocks for years now, i.e. their persistent underperformance.
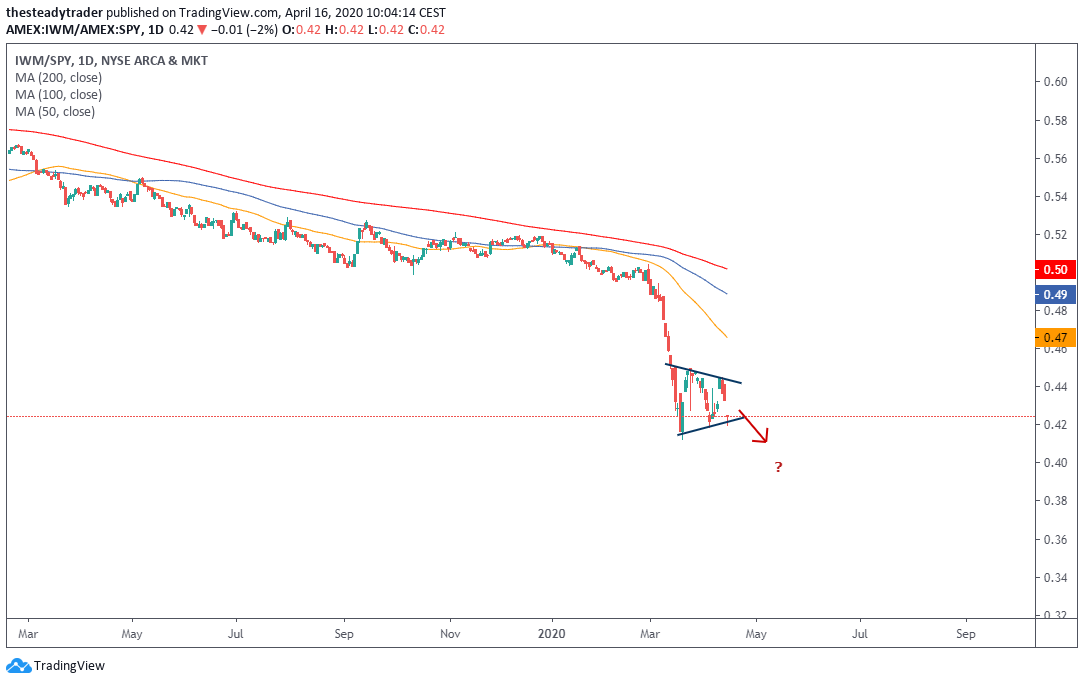
Over the past twelve to eighteen months or so, this relative weakness has accelerated. In the first half of March it came to a complete collapse. After a few weeks of consolidation, this underperformance of IWM versus the SPDR S&P 500 ETF (NYSEARCA:SPY) looks set to continue.
Click to Enlarge
Besides smaller balance sheets and less cash in relative terms versus their large-cap peers, smaller-cap stocks in the Russell 2000 are also more highly leveraged than ever before. At present these companies are showing a net-debt/EBITDA ratio or about 8 times, which compares to about 4.5 times in 2008. This is to say that the current economic downturn from a credit risk perspective is highly likely to adversely impact small-cap companies significantly.
IWM ETF Stock Charts
On the multi-year weekly chart we see that IWM in March cleanly snapped its decade-long up-trending channel. As a result of the multi-week bear market rally, it is now revisiting the underbelly of said trend. From a technical perspective, it is likely that this former area of support will act as resistance for a while.
Finally, on the daily chart we see that the 30% bounce earlier this week had IWM back at a simple horizontal line of resistance that also marked the late 2018 lows. The bounce itself could also be looked at as a bear-flag formation (blue parallels), which as the name indicates, would have bearish implications for the ETF.
While some more near-term backing, filling, and even a higher prices in this ETF cannot be ruled out, given how oversold things were in mid-March and how high market volatility remains, odds favor a resumption of the down-trend.
Trading IWM
Active investors and traders could look to ‘fade’ the recent rally and short IWM in the $118 – $128 range. Yes, that is a wide range, but it is also required to look at prices in ranges at present with volatility high.
A next downside target is $110, possibly followed by $105.
Do you like high probability stock, ETF and options trades? Serge Berger sends them out for free daily. Sign up at www.thesteadytrader.com