My indicators tried to push into bullish territory during Monday’s rally, but as the market’s advance stalled, they reverted to giving bearish readings as of yesterday’s close.
I continue to worry about the narrow leadership of the mega-cap technology stocks, which tells me that the overall market is not as healthy as it looks. That said, my two main trading rules still apply: Don’t fight the Fed and don’t fight the tape.
The Fed has made no indication that it will raise interest rates or reverse its easy-money policies anytime soon, and the excess liquidity it’s providing continues to fuel the rally.
With the S&P 500 holding above both its 50-day and 200-day moving averages, it is safe to say we’re in a bullish mode, so I will recommend buying a call option on MACOM Technology Solutions Holdings, Inc. (NASDAQ:MTSI).
Semiconductors are Sharing the Mega-Caps’ Moment
Semiconductor companies are tied into the tech sector because they provide the chips that allow our tech to function.
The mega-cap stocks — or FAANGM stock, if you prefer — are all connected to the tech sector too.
As a result, the tech sector is seeing more buying, which has bled over into semiconductor stocks.
If you look at the chart below, you can see that the Philadelphia Semiconductor Index (SOX) has outperformed the S&P 500 since the crash in March.
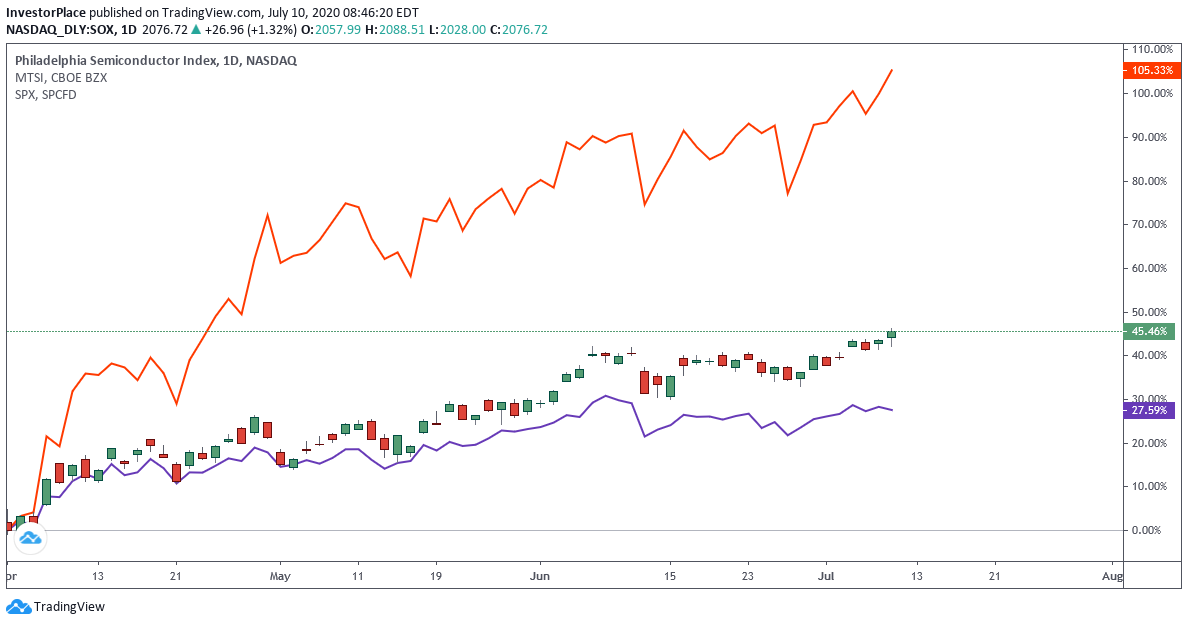
Daily Chart of the Philadelphia Semiconductor Index (SOX), S&P 500 (SPX) and MTSI — Chart Source: TradingView
The red line is MTSI, and you can easily tell that the stock has risen more than the SOX.
But its technical picture is even stronger than you think.
MTSI is on the Verge of Breaking Out
If you look at the chart below, you can see that MTSI’s trend has been leading it higher ever since the market collapsed in March. But in early May, up-trending resistance started to emerge, and shortly after that, a “golden cross” appeared.
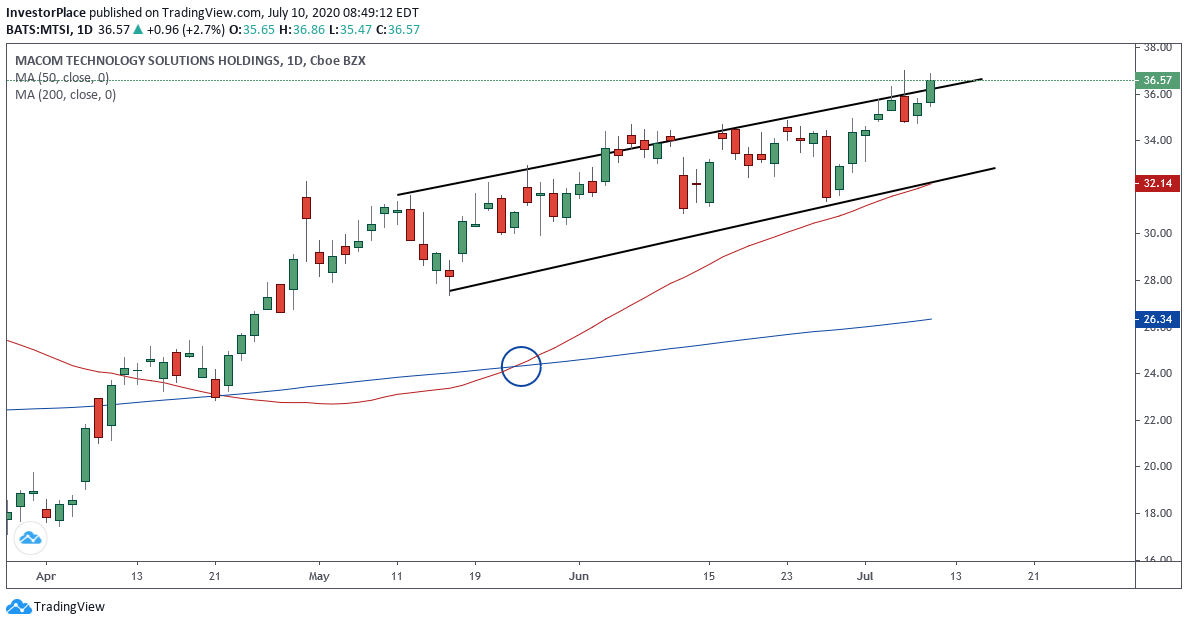
Daily Chart of MACOM Technology Solutions Holdings, Inc. (MTSI) — Chart Source: TradingView
Regular readers will recognize the golden cross as a technical formation in which a shorter-term moving average crosses above a longer-term moving average. It signals that the short-term bullish momentum is overtaking the long-term bearish or neutral trend.
In this case, the 50-day moving average has crossed above the 200-day moving average. It is circled in blue in the chart above.
Since then, MTSI has tried to break out of its up-trending range, and it is making another attempt now. Traders should be there to collect.
Buy to open the MACOM Technology Solutions Holdings, Inc. (MTSI) Aug. 21st $40 Calls (MTSI200821C00040000) at $1.70 or lower.
InvestorPlace advisor Ken Trester also brings you Power Options Weekly, which delivers 5 new options trades and his latest trading advice to you each Friday. Trester has been trading options since the first exchanges opened in 1973 with a winning streak that goes back to 1984 with money-doubling average annual profits since 1990.