
Palantir Technologies (NYSE:PLTR), a Colorado-based provider of data analytics and security services, was briefly out of favor among stock traders. The tide of sentiment has turned, however, and we can use PLTR technical analysis to prove this. If you’re a momentum-focused investor, you really ought to consider buying Palantir stock.
Palantir Technologies recently disclosed a deal with Microsoft (NASDAQ:MSFT) in which Microsoft will integrate some of Palantir’s products into its Azure cloud-computing services for public-sector clients. In addition, Palantir posted impressive second-quarter 2024 results, including revenue of $678 million, beating Wall Street’s call for $653 million.
These developments gave Palantir stock a boost of rocket fuel. So now, let’s see what the charts are telling us about the tug-of-war between the buyers and the sellers.
After the Bounce, the Buyers Pounced
Sometimes, stock charts can be messy and frustrating. When it comes to the following daily candlestick chart for PLTR stock, however, it’s clean and picture-perfect.
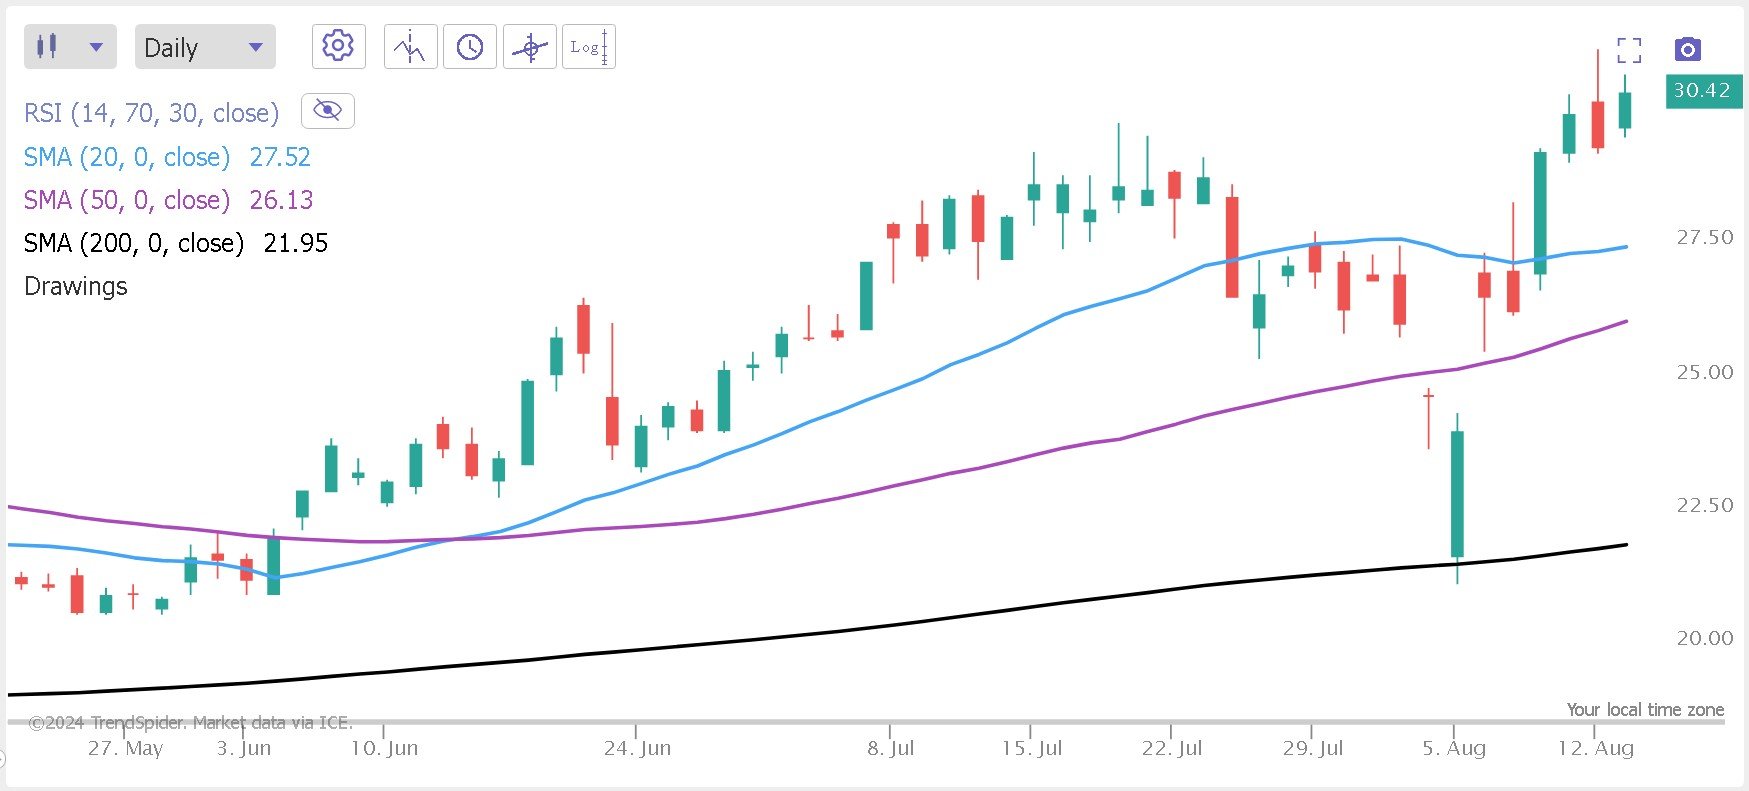
It doesn’t get any better than this — if you’re bullish, that is. As you can see, Palantir stock bounced right off of the 200-day moving average (the black line), which is a long-term trend indicator.
Furthermore, PLTR stock is above the 50-day moving average (purple line), a medium-term trend indicator, as well as the 20-day moving average (blue line), a short-term trend indicator.
Plus, the lines are in the right order for the bulls: the 20-day moving average is on top, the 50-day moving average is in the middle and the 200-day moving average is on the bottom. The Palantir stock buyers are winning, without a doubt!
Don’t Get Greedy With Palantir Stock
On the other hand, the PLTR stock buyers can’t afford to be complacent. If the stock becomes extremely overbought, then it will be time to consider an exit strategy.
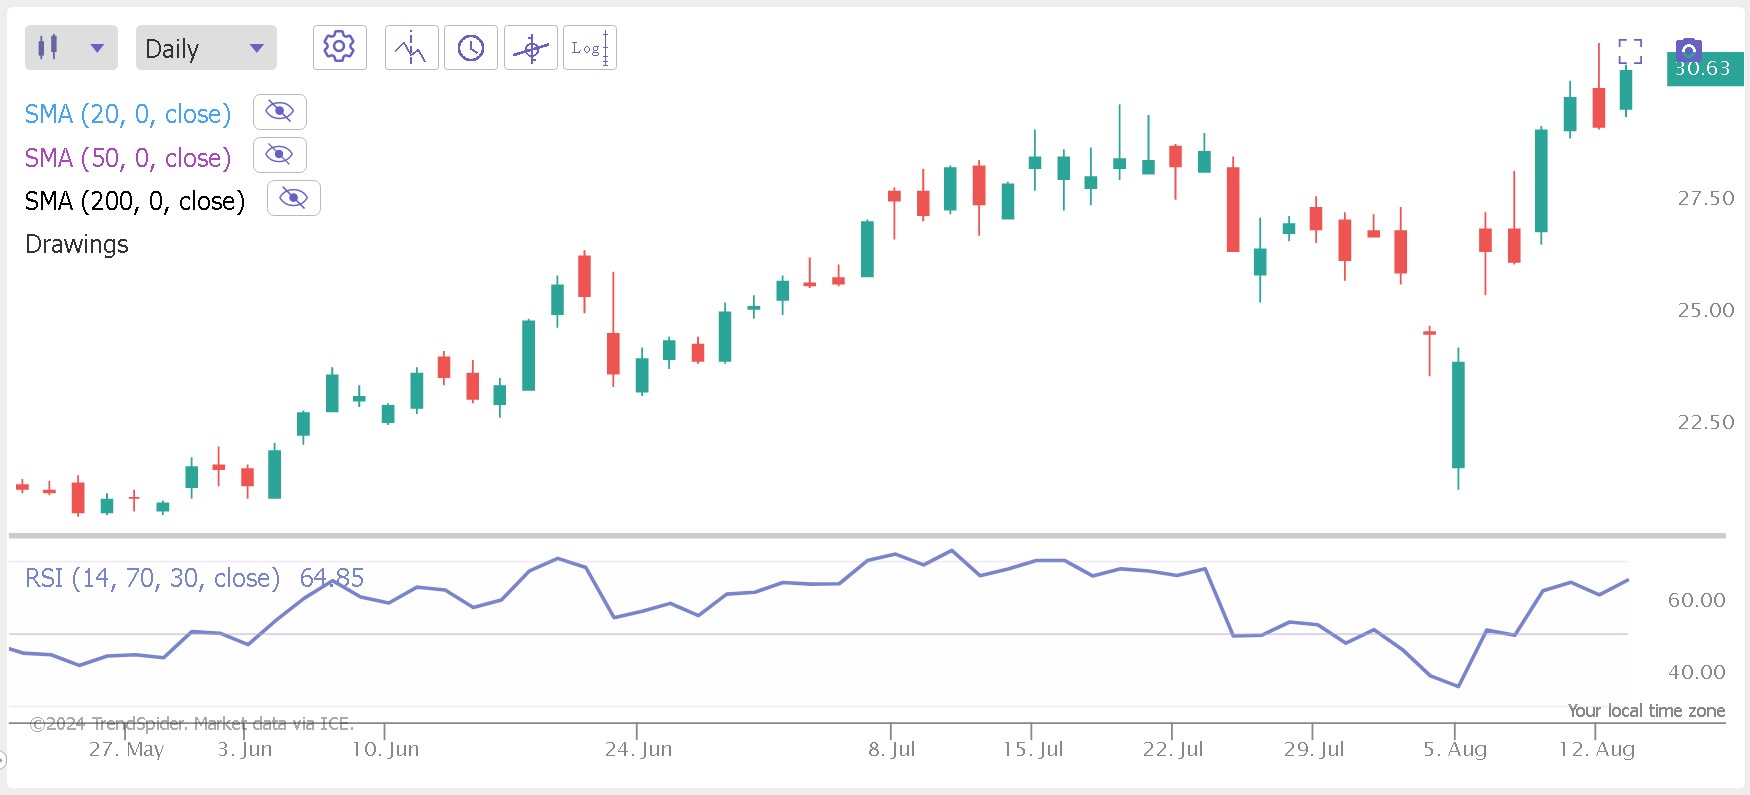
The Relative Strength Index or RSI is an indicator that can help you decide when to take profits. When the RSI on this daily Palantir stock candlestick chart goes far above 70, the stock will be overbought and it will make sense to cash out your shares.
As of this writing, the RSI was around 65, so it’s not in the overbought danger zone yet. Even if it’s in the low 70’s, that’s not too overbought. When the RSI starts getting into the mid-70’s or higher, however, then PLTR stock is susceptible to a pullback. So, keep a close watch on the RSI in the coming days.
PLTR Technical Analysis: The Bulls Remain in Control
Palantir Technologies reported excellent financial results and disclosed a deal with Microsoft. These news items helped to put the Palantir stock buyers in the driver’s seat.
Yet, PLTR technical analysis shows that the bulls need to monitor the charts and be ready to take profits. For now, however, it’s fine to grab a few Palantir shares and ride the momentum to higher price points.
On the date of publication, David Moadel did not have (either directly or indirectly) any positions in the securities mentioned in this article. The opinions expressed in this article are those of the writer, subject to the InvestorPlace.com Publishing Guidelines.
On the date of publication, the responsible editor did not have (either directly or indirectly) any positions in the securities mentioned in this article.