Is the Iran War nearly over?… conflicting reports on what’s happening… how the markets looked on Friday before this rally… what the A, B, C System is telling us today
As I write on Monday, mid-morning, stocks are ripping higher on what sounds like a sudden turn toward peace in the Persian Gulf… but the reality is a bit murkier.
Earlier today, President Trump wrote on Truth Social that the U.S. and Iran had held “very good and productive conversations regarding a complete and total resolution of our hostilities.”
Trump then ordered a five-day pause on planned strikes against Iranian energy infrastructure.
This is exactly what our hypergrowth expert Luke Lango had predicted, as he saw parallels between this Middle East volatility and the market turbulence surrounding Liberation Day.
When the economic damage from Liberation Day began showing up in bond markets and consumer confidence, Luke says Trump’s political calculus shifted. On Friday, Luke suggested that we’d see the same thing here.
From his Innovation Investor Daily Notes:
When oil hits $120, consumer sentiment craters, and midterm polling turns ugly, the political calculus shifts.
TACO incoming.
If you’re less familiar with “TACO,” it stands for “Trump Always Chickens Out.”
Sure enough, as I write, TACO is behind soaring stocks and crashing oil prices.
There’s just one problem…
Iran says none of it is true.
State-linked media and officials flatly denied that any talks – direct or indirect – have taken place, with one report insisting there have been “no negotiations” at all.
From that report:
With this kind of psychological warfare, neither the Strait of Hormuz will return to its pre-war conditions nor will there be peace in the energy markets.
So, what’s driving markets right now isn’t a confirmed breakthrough – it’s a narrative built on Trump’s assertion that diplomacy is underway, despite Tehran’s equally firm insistence that it isn’t.
For now, Wall Street is choosing to believe the version that lowers oil prices and reduces geopolitical risk. But if that story cracks, today’s rally could prove just as fragile as the “talks” themselves.
So, where does this leave us?
As I write, this rally feels like a reprieve – a sudden release of pressure after weeks of mounting geopolitical stress.
But as we just pointed out, this rally is based on a contested narrative. And that distinction matters because just 72 hours ago, the market was telling a very different story – one anchored in mounting technical damage beneath the surface.
Even with today’s surge, that damage isn’t fully repaired – it’s simply being papered over by headlines that may or may not hold up. And that means we can’t ignore what the market was signaling as of Friday afternoon.
In fact, it’s precisely in moments like this – when optimism returns quickly and perhaps prematurely – that discipline matters most.
So, let’s briefly rewind to what the market was telling us on Friday and update it based on where we stand today.
As of last week’s close, the market was sending a very different message
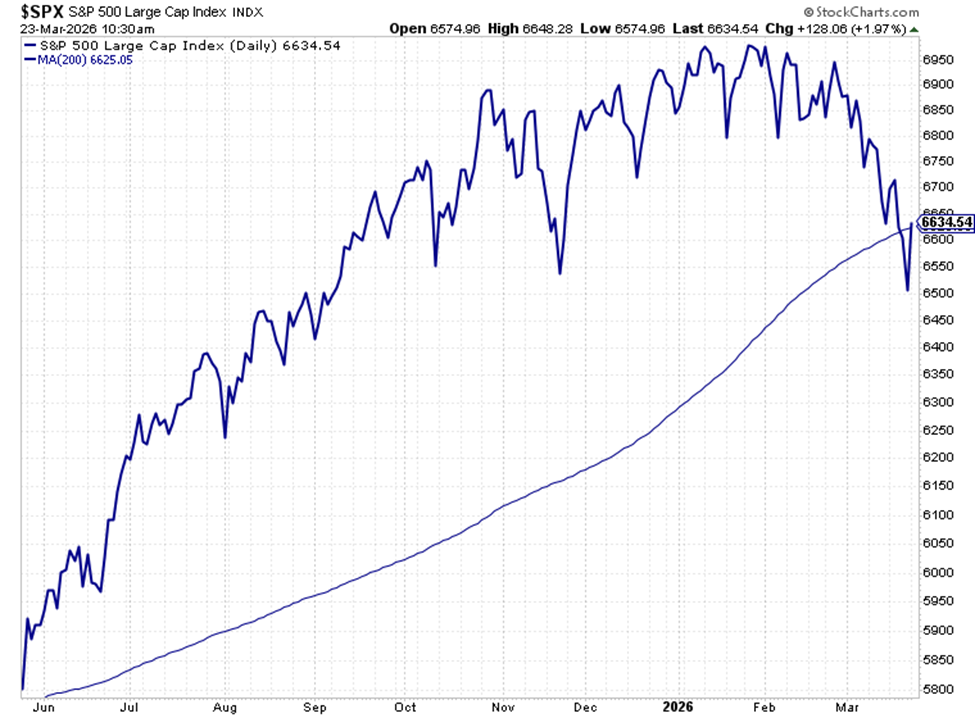
The S&P 500 had broken below its 200-day moving average (MA) – a key long-term trend line that institutional investors watch closely.
As I write, stocks are rallying and the index is climbing back toward that level…
But that doesn’t erase what happened.
A break below the 200-day MA is a clear warning sign. It suggests a market that’s losing momentum – one that may be growing more vulnerable to sharper downside moves if conditions deteriorate.
And importantly, these kinds of technical cracks don’t get “fixed” in a single morning. They either heal over time – or they widen.
That’s why moments like this demand discipline.
Not a reaction. Not a prediction.
A framework.
After all, when headlines are driving sharp swings – as they are right now – it’s easy to get whipsawed by emotion instead of guided by a plan built in calmer conditions.
Fortunately, we have exactly that kind of framework.
What the A, B, C framework is telling us today
Last fall, veteran analyst Brian Hunt laid out a simple, remarkably effective system for identifying when a bull market is truly breaking down.
Not wobbling… not correcting… but actually transitioning into something more dangerous.
What makes Brian’s approach so useful is that it doesn’t demand that we accurately predict anything. We don’t need to guess about interest rates, AI valuations, or geopolitics. We simply watch what the market is doing.
As Brian put it, you just need “a basic knowledge of stock trend health.”
That “trend health” boils down to three signals – what we’ve come to call Brian’s A, B, C framework here in the Digest.
So, what exactly are we looking for?
Well, in the lead-up to the 2008 financial crisis, the market began flashing warnings months before the worst of the damage. First came a breakdown below key prior lows. Then the long-term trend rolled over. Finally, the market began carving out a pattern of persistent weakness.
Here are the mile markers (they don’t always appear in perfect order):
- A six-month downside breakout (A)
- Trading below a declining 200-day moving average (B)
- A new series of lower highs and lower lows on the way to a new 12-month low (C)
From Brian:
All major negatives by themselves. Combined, they were hugely negative.
That was the time to get out.
Most importantly – and highly relevant today – Brian wasn’t identifying this in hindsight. These were real-time signals that proved invaluable.
To me, this horrid action is not obvious only in hindsight. It was obvious at the time.
The majority of one of the worst bear markets in history could have been avoided by using basic technical analysis.
So, where are we today?
As we noted at the top of today’s Digest, the S&P broke below its 200-day MA, yet is trying to retake it as I write.
In Brian’s system, that corresponds to “B.” It’s one of the earliest signs that a market’s long-term trend may be weakening.
Now, to be precise, Brian’s signal calls for a declining 200-day moving average, not just a brief dip below it – and we’re not there yet.
But Friday’s break still matters. It marks the first meaningful deterioration in the market’s structure since last year’s Liberation Day volatility. This is weakness that deserves our attention, even if today’s rally is obscuring it.
What makes this moment more consequential, however, isn’t just “B.” It’s how close we are to triggering “A.”
As you can see below, on Friday, the S&P 500 hit a new six-month low at 6,515.
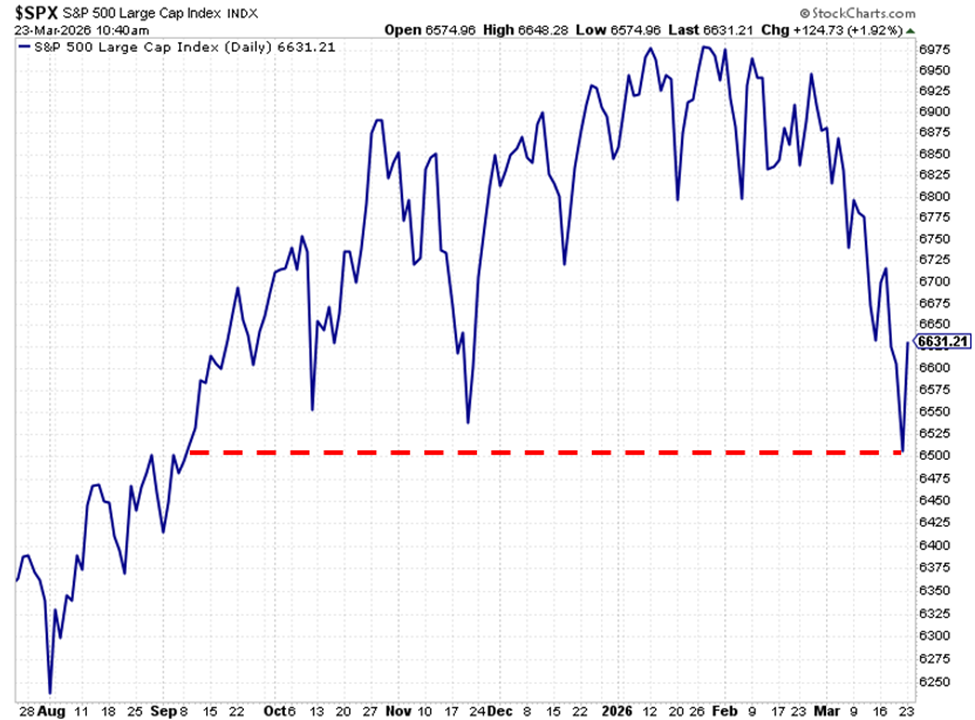
Yes, we’re seeing a bounce today. But let’s be clear about what that bounce represents…
We’re not comfortably above support – we’re leaning up against it.
This means this market is still walking a very fine line.
If the apparent progress with Iran proves real, the market will stabilize and hindsight will likely view the last few weeks as a routine shakeout.
But if that narrative unravels, we could see signals “A” and “B” triggered in quick succession – a combination that would significantly raise the odds that something more serious is unfolding beneath the surface.
What about “C”?
This is where things get more nuanced.
In Brian’s original work, “C” is defined as the moment the market breaks to new 12-month lows. But in practice, that kind of breakdown doesn’t come out of nowhere.
It’s preceded by a clear shift in behavior – the pattern of “lower highs” and “lower lows” that Brian identified as a thumbprint of a bear market. And if you look at the S&P since January, you can reasonably argue that this process may already be underway.
Below is the S&P 500 chart again.
Notice the clear sequence of lower highs and lower lows. It’s too soon to declare this the new dominant trend – but it’s certainly not bullish.
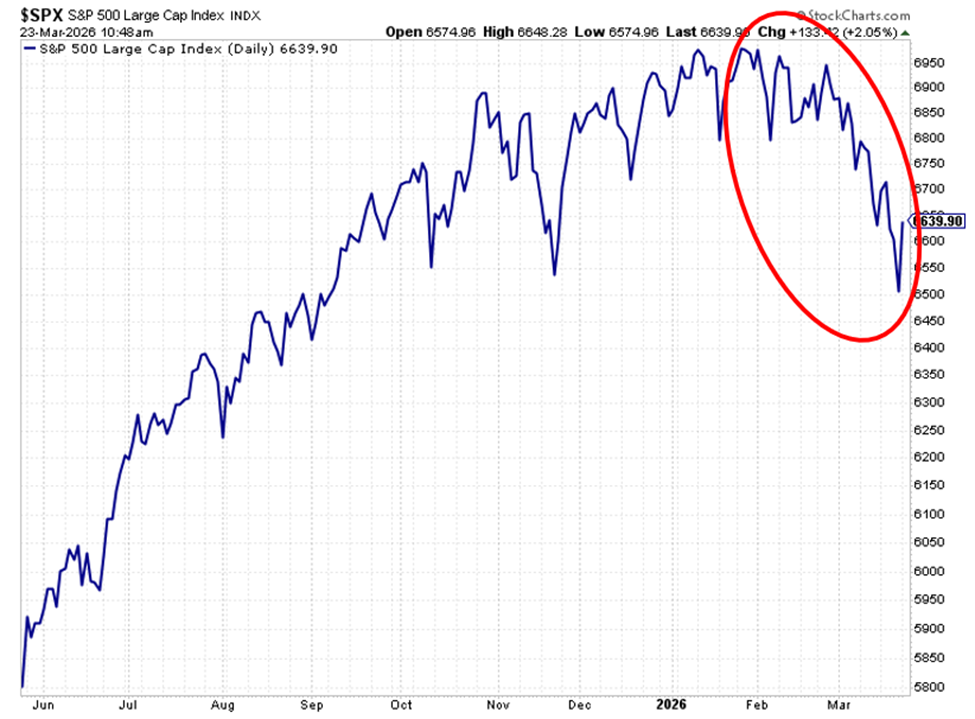
So, rather than thinking about “C” as a single moment, it’s more helpful to think of it as a progression. The series of lower highs and lower lows is the setup. The break to a 12-month low is the confirmation.
Altogether, if the weeks ahead bring:
- A decisive break below the 6-month low (A)
- A clearly declining 200-day moving average (B)
- And an ongoing pattern of lower highs and lower lows as we fall toward a 12-month low
…then the market is no longer just “at risk.” At that point, it’s behaving exactly the way it has ahead of past major declines.
In that situation, you could say that the market will have its finger on the trigger – even if the final confirmation (a 12-month low) hasn’t yet arrived.
But here’s why we’re still optimistic
Today, we’re seeing a relief rally that we’re not sure will hold.
That said, even on Friday, the bond market wasn’t fully confirming the bearish story that stocks were telling us.
Credit spreads – the extra yield investors demand to own riskier corporate debt – have widened modestly in recent months. Investment-grade spreads have moved from 0.81% in December to about 0.90% today.
That tells us risk is rising but not spiking.
High-yield spreads remain relatively contained, suggesting bond investors haven’t been pricing in a full-blown crisis.
At the same time, Treasury yields have been elevated – not for bullish reasons (money flooding into risk assets) but because of sticky inflation and a Fed that’s in no rush to cut rates.
The overall takeaway is that the bond market was signaling rising risk, but not distress – a cautious environment, not a crisis.
So, even as stocks hit the panic button at the end of last week, the bond market stayed comparatively calm. And given the bond market’s reputation as “the smart money,” that was encouraging.
Which market will be right going forward?
That’s the question we’ll be answering in the weeks ahead.
If the bond market is correct, then the last few weeks of selling pressure was likely a shakeout – not the start of a sustained breakdown.
In that case, we’d be looking for the S&P to continue stabilizing, reclaim its 200-day MA, then push back toward recent highs.
But if stocks were right to flash warning signs – and the bond market is simply late to react – then conditions could deteriorate quickly.
Credit spreads would begin to widen more aggressively, liquidity would tighten, and the path toward Brian’s “C” signal would become much clearer.
Right now, the market’s direction is balancing on a tightrope, and this morning’s news about talks with Iran may determine which way we fall.
If the current narrative holds, if diplomacy is real and tensions genuinely ease, then today’s rally could mark the beginning of a sustained push higher.
But if that narrative cracks, today’s gains will disappear just as quickly as they arrived. And in that scenario, the technical damage we saw last week would come rushing back into focus.
Put it all together, and we don’t have an “all clear” – but this isn’t a full retreat either
This is a make-or-break moment.
So, rather than trying to predict the next headline, we’re better served by preparing…
Know what you’ll hold if this today’s gains fizzle… know what you’ll sell and at what price… and know what you’ll buy if this rally accelerates.
Most importantly, stay anchored to a process that removes emotion from your decisions, and follow that plan.
That way, if this does evolve into something more serious, you won’t have to guess what to do – you’ll already know.
Have a good evening,
Jeff Remsburg