
Listen to the audio version of this article (generated by AI).
Most investors spend their time trying to figure out what to buy.
But according to Keith Kaplan, just as important– if not more – is when you buy.
In today’s Friday Digest takeover, Keith, the CEO of our corporate partner, TradeSmith, explains how his team uncovered recurring seasonal patterns across thousands of stocks – specific windows when certain names have historically outperformed with remarkable consistency.
The goal isn’t to predict the future. It’s to stack the odds in your favor using decades of market data.
Keith also shares why these patterns have become the foundation of TradeSmith’s Seasonality tool, and why he believes several important opportunities are approaching.
If you’d like to see how the system works, Keith will walk through it during his free Breakthrough 2026 event on Thursday, July 16, at 10 a.m. ET.
To register – and try the tool today for free – click here.
Whether you use this approach or not, I think you’ll come away looking at market timing in a very different way.
I’ll let Keith take it from here.
Have a good evening,
Jeff Remsburg
In June 1944, as the Allies prepared to invade Normandy, their plans hinged on one man, Group Captain James Stagg.
And he was telling General Dwight D. Eisenhower, “Don’t do it!”
Turns out, he was right.
Everyone knows the Allies stormed the beaches on June 6, 1944. What you may not know is that D-Day was supposed to happen a day earlier – on June 5.
And if Eisenhower had ignored Stagg’s warning… and went ahead with the invasion a day earlier… the Allies could have failed.
Could one day have made that much difference?
Absolutely. Because Stagg’s warning came down to the most fundamental element of planning a seaborne invasion: the weather.
You see, Stagg’s path to the Allied Command was different than that of the more conventional officers in the war-room.
He was a meteorologist best known for leading an Arctic expedition in 1932. And when the war began, he was the superintendent of Kew Observatory — the United Kingdom’s weather-forecasting headquarters.
Now, Eisenhower was asking Stagg for the most crucial observations of his career: conditions in the English Channel ahead of the largest amphibious assault in history. And Stagg’s network of Royal Air Force weathermen had told him that a massive storm was rolling in.
Luckily for the U.K., the U.S., Canada, France, and the world, Eisenhower listened to Stagg. The landings took place on June 6, 1944, after the storm had passed. Eleven months later, the Allies were celebrating victory in Europe.
Timing is important for us as investors, too. It’s tempting to leave buying and selling decisions to gut feel. But at TradeSmith, we believe — like Stagg did — in following the data.
One of those signals is what we call “seasonality” — recurring patterns that repeat year in, year out with remarkable consistency.
I’ll show you how it works today… plus how seasonal trades generated 857% total growth in an 18-year backtest.
Buy on These “Green Days”
I didn’t come to TradeSmith from Wall Street. I’m a software engineer by training.
So, when my team and I went looking for an edge for investors, we didn’t start by asking what should move a stock. We started by asking what the data already shows.
We built software that scans more than 5,000 stocks — decades of price history — and asks a simple question. Does this stock behave differently at certain times of the year than others?
The answer, again and again, was yes.
We’ve found historically reliable windows across thousands of stocks – specific times of the year when they tend to rise or fall.
We call the bullish windows “green days.” And we built a trading system around them that spots these seasonal patterns with an 83% historical accuracy rate.
In other words, they’ve shown up in about eight years out of every 10. That’s not a guarantee they’ll show up again. But it’s a statistical edge you can use to stacks the odds of success in your favor.
Seasonality isn’t new:
- Commodity traders have always tracked planting and harvesting cycles.
- Energy markets move with heating and cooling demand.
- Gold has long shown seasonal strength tied to jewelry demand and annual buying patterns in India and China.
- And stock investors track seasonal patterns like the January Effect and the Santa Claus Rally.
What’s new is that we can now measure it precisely – across thousands of stocks, over decades of data, and down to specific days.
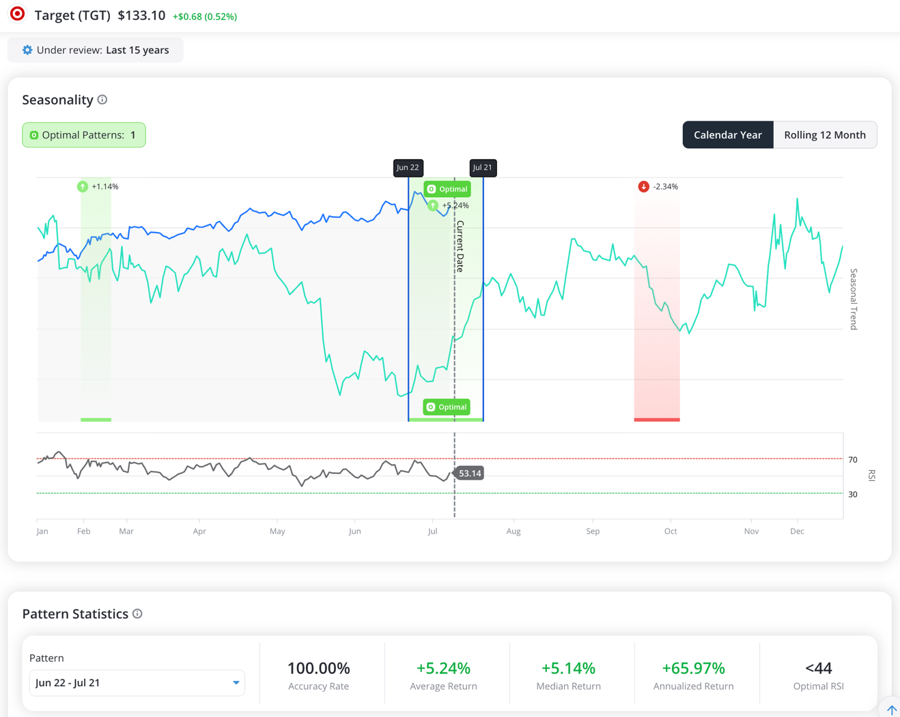
Target Corp. (TGT), for example, has climbed during the same 29-day window — late June into late July — in 15 straight years, gaining an average of 5.2%:
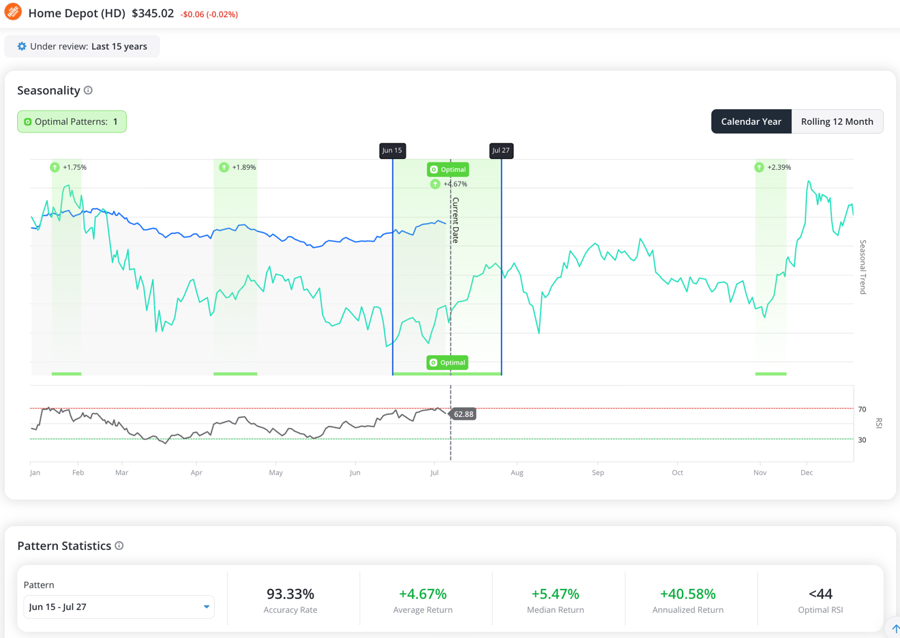
Home Depot Inc. (HD) has done the same between mid-June and late July, rising 93.3% of the time over 15 years, with an average gain of 4.7%:
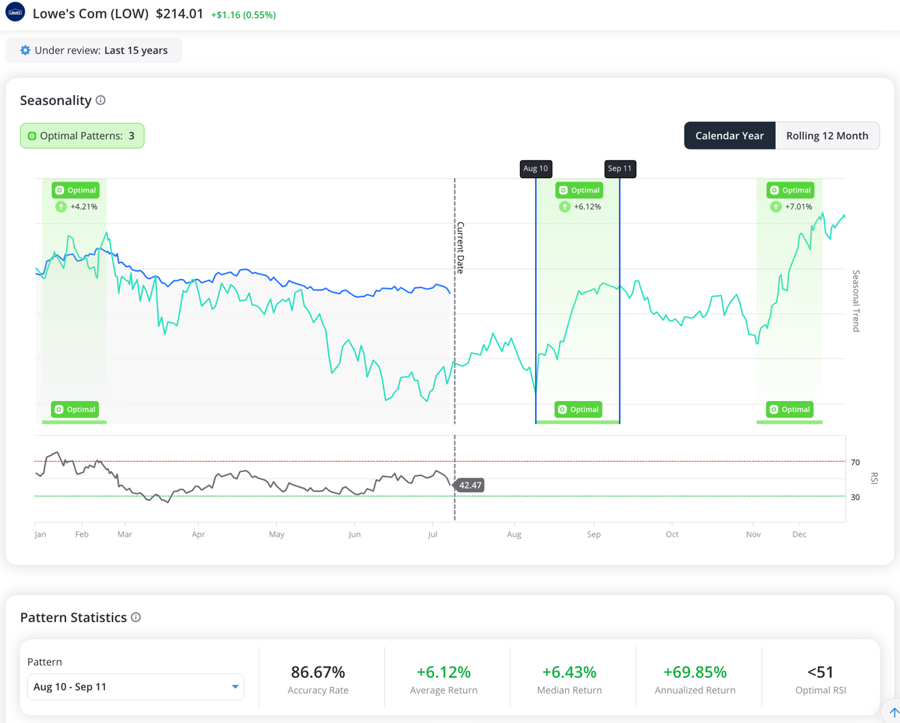
But rival home improvement store Lowe’s Cos. Inc. (LOW) optimal window comes nearly two months later.
LOW has gone up 86.7% of the time from August 10 to September 11 during the past 15 years, with an average return of 6.1%:
Over an 18-year backtest, these seasonal trades produced 857% in total growth — more than double the S&P 500 over the same stretch. Even in 2007, the worst year in the test, the strategy still came out ahead.
You don’t have to just take my word for it. I’ve asked my team to make a free trial of our Seasonality tool available so you can try it out for yourself.
Test Drive Our Seasonality Software Today
You can try out our software on the stocks you own with this free, limited-time trial version.
We’re making it available ahead of our Breakthrough 2026 event. It’s all about the seasonal patterns you need to be aware of in this critical year.
That’s why we’ve made a version of our Seasonality software available for you to explore now.
We’ve unlocked access so you can see the seasonal “green days” for thousands of stocks ahead of our Breakthrough 2026 event.
It kicks off Thursday, July 16, at 10 a.m. ET.
I’ll walk you through how we uncovered these patterns, why they persist even in chaotic markets, and how you can use them to guide real-world trading decisions.
More important, I’ll be going into detail about the fast-approaching seasonality patterns you need to be aware of.
Knowing when the windows are opening and closing likely matters more to your wealth than any single decision you’ve made.
The first date you’ll want to circle on your calendar is July 16. If seasonality patterns hold this year, it could open up a lucrative trading opportunity in one of the market’s hottest AI stocks.
Reserve your spot here. I hope you’ll join us.
All the best,
Keith Kaplan
CEO, TradeSmith
P.S. Keith has only scratched the surface here. During his free Breakthrough 2026 event on Thursday, July 16, at 10 a.m. ET, he’ll explain the research behind Trade Cycles, show how his team identifies recurring seasonal opportunities across thousands of stocks, discuss why he believes the market is approaching an important turning point, and share three free stock recommendations. It’s free to attend, but you do need to reserve your seat in advance. Click here to sign up.


