
The sharp broader stock market rally over the past two weeks has not only caught the bears wrong-footed for the immediate term, but has also led to above average rallies in some mega cap stocks such as that of Amazon (NASDAQ:AMZN). AMZN stock, however, is now entering a major layer of technical resistance that could prove difficult to get past, and active investors and traders could even look to play a short-side trade.
Before looking at the charts of AMZN stock, it is important to note that for “trading” purposes I personally believe holding positions in stocks through known unknowns such as earnings reports is a high risk strategy. To wit, Amazon.com is currently scheduled to report its next batch of earnings on Feb. 7, or just about four weeks from now. That, in my opinion, is just enough time to leg into a trade prior to earnings but with the idea of being out of the trade again before the earnings report.
AMZN Stock Charts
Click to Enlarge
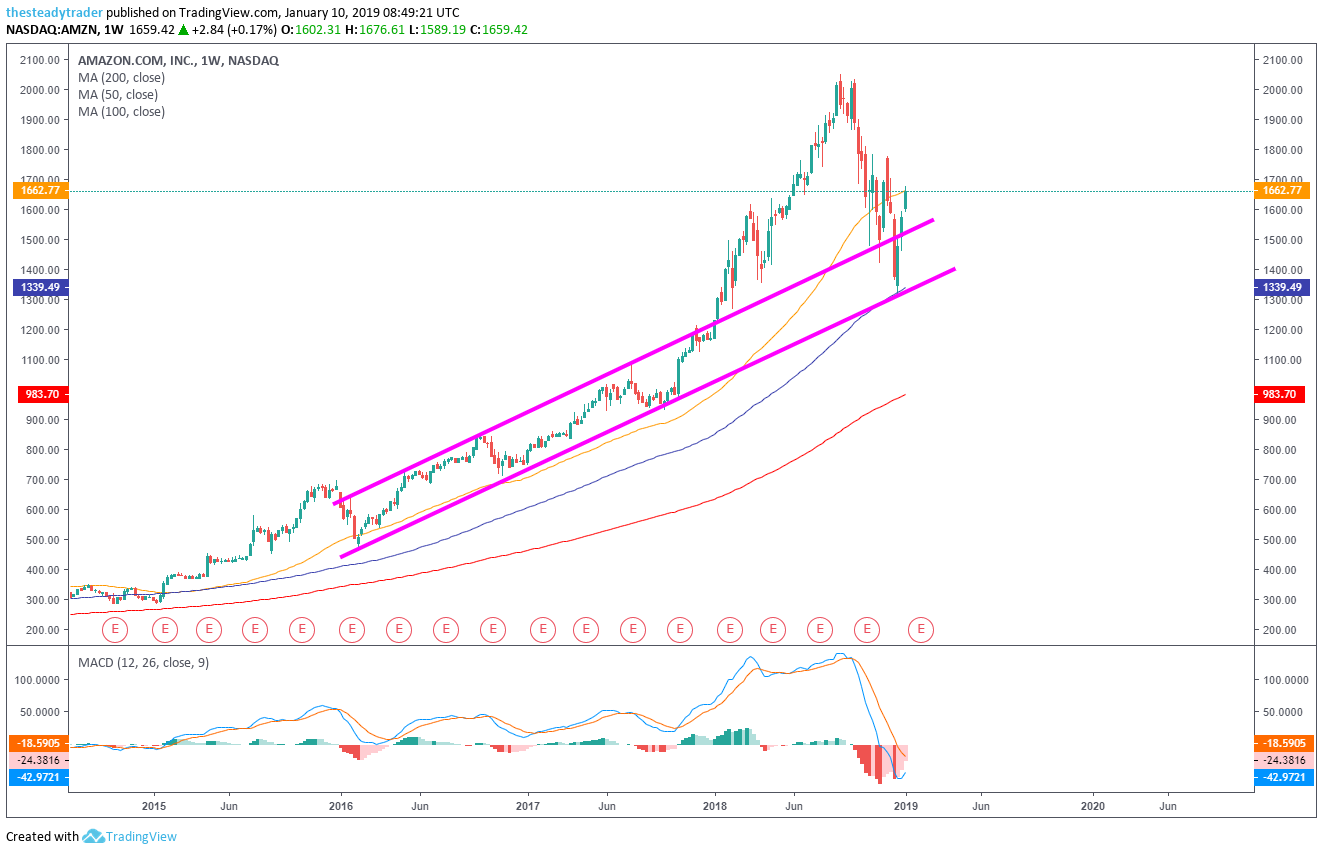
Moving averages legend: red – 200 week, blue – 100 week, yellow – 50 week
One key concept of technical analysis and general market exuberance I often discuss with clients is the overshooting of stock price moves to the up or downside. In the case of AMZN stock, as we see on the multiyear weekly chart, an extreme overshooting rally above its longer-standing up-trends (purple parallels) took place from about the fall of 2017 into the September 2018 highs.
As gravity not only works in our physical surrounding but also in the stock market, this stock has since plummeted, or mean-reverted right back to the lower end of the longer-standing up-trend. While this “overshooting” rally was fun for the chart chasers for about one year, I can just about promise you that many if not most of those chasers likely didn’t sell the stock at the highs in September but rather rode it right back down.
In other words, chasing steep charts for anything more than very-near-term moves is a sucker’s game.
Click to Enlarge
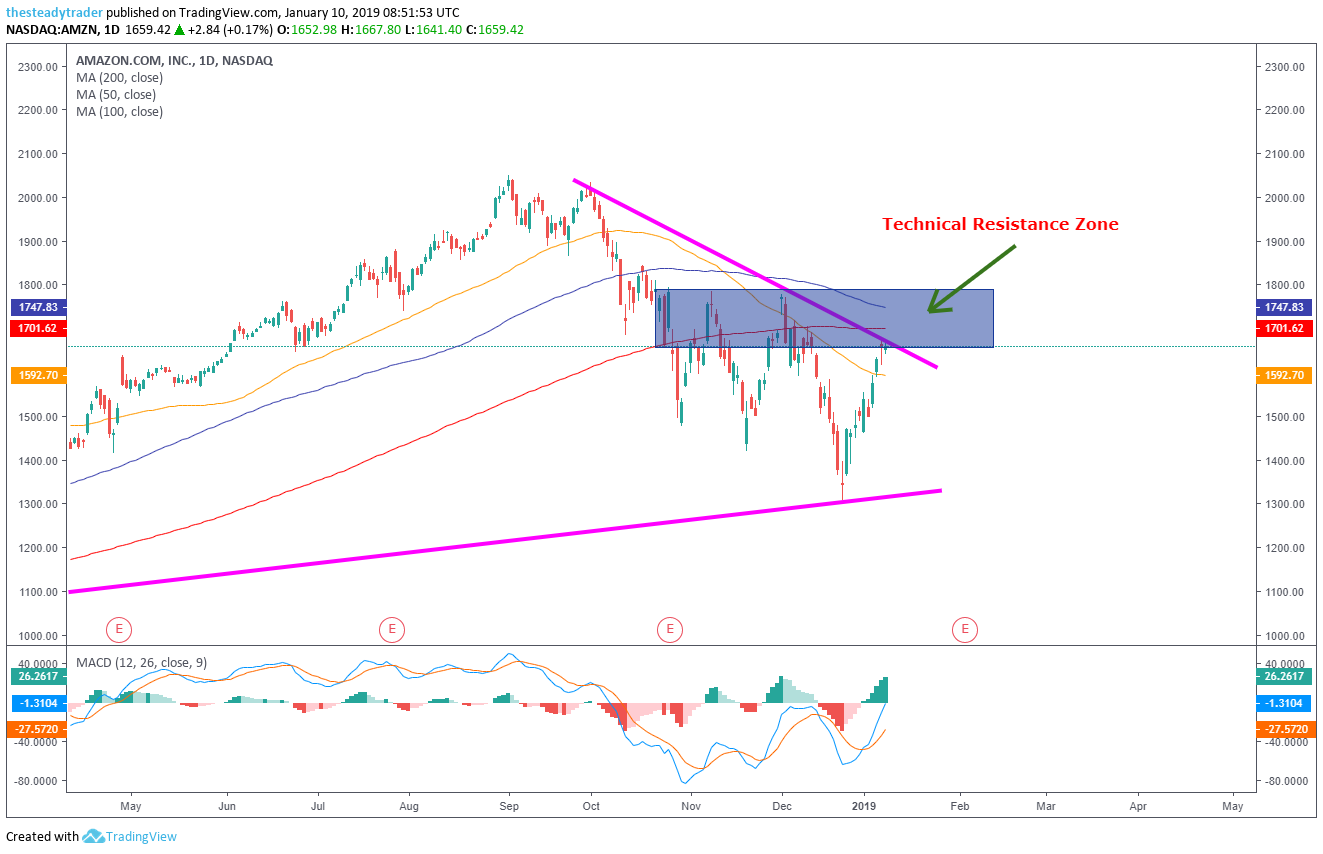
Moving averages legend: red – 200 day, blue – 100 day, yellow – 50 day
On the daily chart we see that AMZN stock in late December 2018 bounced off the lower end of trend but now after a sharp 26% rally over the past couple of weeks is bumping into a significant area of technical resistance.
This layer of resistance is made up of diagonal resistance from the September 2018 highs, horizontal resistance as well as the 100- and 200-day simple moving averages.
Less risk averse-traders and active investors could look to take a stab on the short side of AMZN stock around the $1,660 area, using a first downside profit target at $1,450 and a stop loss at $1,800. Alternatively, buying at the money put spreads using options expiring in March (but only holding the trade at most to just before the February earnings date) could make sense.
Get FREE ACCESS to Serge’s renowned Stock Market Scanner with actionable trade ideas. Get it HERE.