Shares of technology (and related) stocks have shown relative strength versus the broader U.S. stock market over the past week or so. Increasingly large tech names such as Netflix (NASDAQ:NFLX) are coiling to for technical trading breakouts, or have already done so. NFLX stock in particular is coiling in a notably tight range at the moment, and barring any quick bearish reversal, the path of least resistance points higher, for a trade.
While I have learned over my career that it takes more than simply glancing at a chart to come up with high-probability trading and investing opportunities, I have also learned not to “fight the chart,” in particular when a specific technical pattern seems to be found in abundance in any sector or group, or in the stock market as a whole.
NFLX Stock Charts
Click to Enlarge
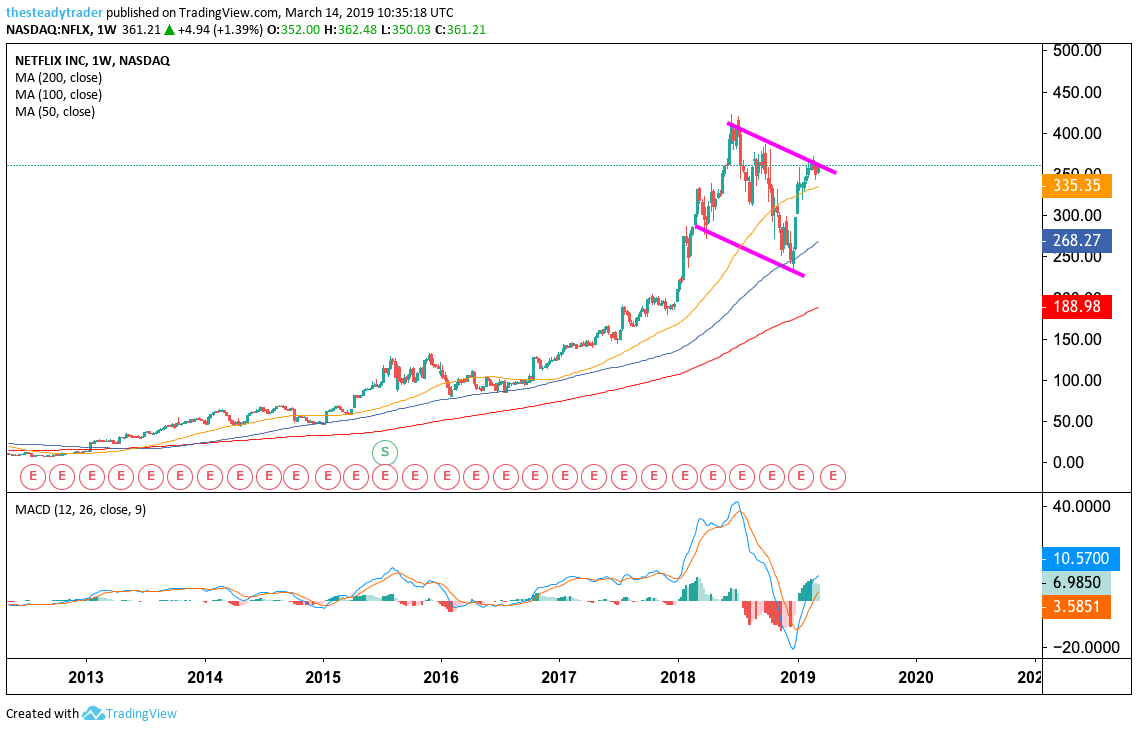
Moving averages legend: red – 200 week, blue – 100 week, yellow – 50 week
To gain some perspective on the trade idea I am about to lay out, let’s first look at the big-picture, multiyear weekly chart. Here we see that NFLX stock, while still in a longer term up-trend, has been in a much more volatile environment since topping out in June 2018. At least in part, this also reflects a notably more volatile environment for stocks … so you know.
On the chart we see that this stock had a sharp snap-back rally over the past two months or so, one that measures close to 60% … which also brought it back to the upper end of a trading range as marked by the two purple parallels. Given the steepness of this rally and (from a fundamental perspective) increasingly difficult top- and bottom-line comps for the next couple of quarters, I have difficulty seeing how this stock can rally to fresh and sustainable all-time highs from here.
That being said, another 10% or so higher is most definitely not out of the question.
Click to Enlarge
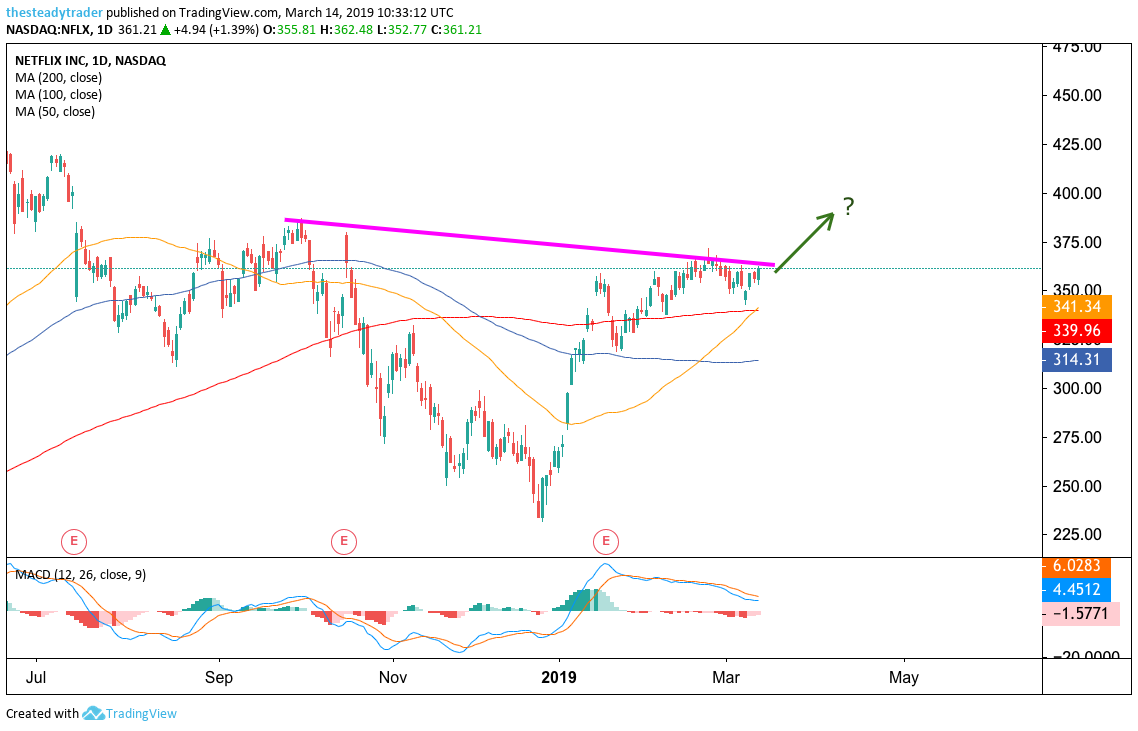
Moving averages legend: red – 200 day, blue – 100 day, yellow – 50 day
On the daily chart, we see that NFLX stock has over the past few weeks slipped into a sideways consolidation phase, just above its red 200-day moving average and below simple resistance at the upper end of the aforementioned trading range. Such price behavior at a key level like this often times acts as a working off of near-term overbought conditions so that the stock can continue higher again, at least for a trade.
Active investors and traders here could look to buy NFLX stock upon a break and hold above the $365 area. A next upside target then opens up near the round $400 area. So you know, its price has a tendency to gravitate to big, round numbers.
Any strong one-day bearish reversal would be a stop loss signal.
Get FREE ACCESS to Serge’s renowned Stock Market Scanner with actionable trade ideas. Get it HERE.