Over the past week or so, a good number of the large money center banks reported their latest quarterly results. In the aggregate, the results were fine and the stocks held up well both in relative and absolute terms following the reports. As a result, similar stocks like Citigroup (NYSE:C) now look poised for a breakout to the upside. C stock has been coiling in a technically well-defined pattern.

Before I dive in deeper with an analysis of C stock, allow me to say that while the technical picture for the stock and others in the space looks good for a bullish trade, the broader economic backdrop leaves much left to be desired. As such, my suggestions here is a trading call and not a call to buy banking stocks for the longer term.
As always, my analysis starts from a top down perspective, i.e., on the sector level, which is to say I am looking for relative strength (or relative weakness for shorts) at the sector or stock group level.
C Stock Charts
Click to Enlarge
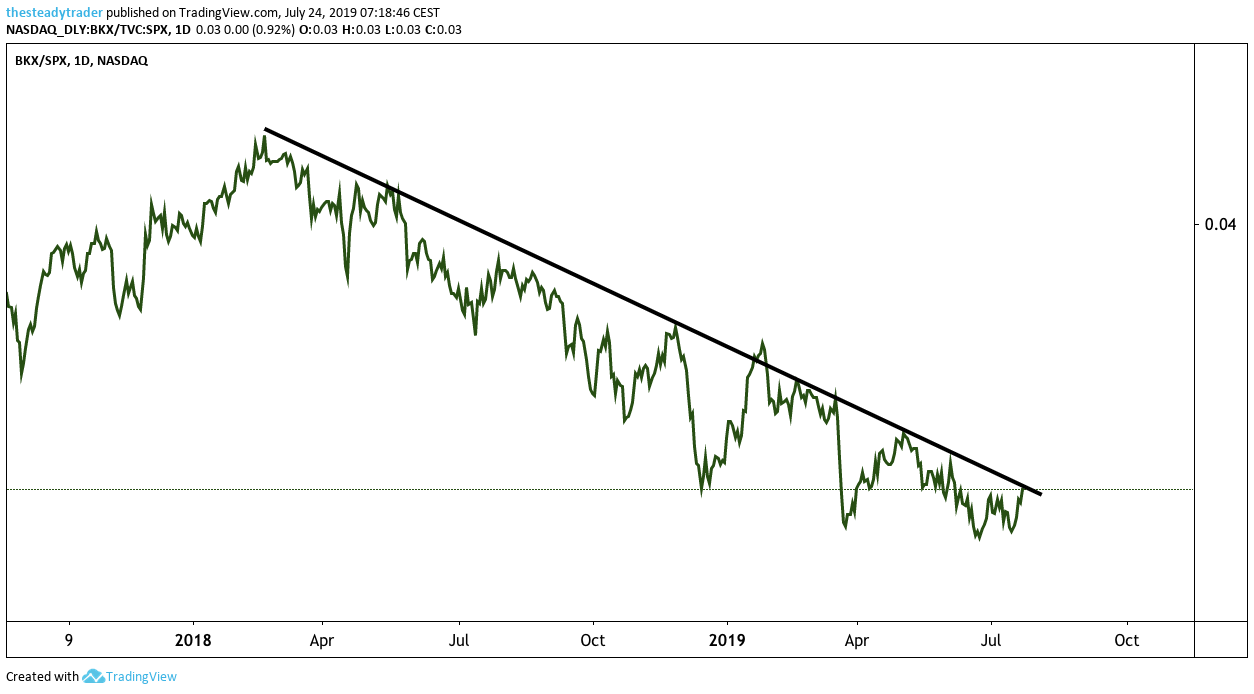
The first chart I’m presenting today represents bank stocks versus the S&P 500
. Here, we see the longer-standing and pervasive relative under-performance of large-cap banking stocks as a group, versus large cap stocks as as whole. While we have yet to see a real breakout in this chart, one could envision that not much more is needed for some relative strength to come into this group of stocks and thus possibly break the green line up and above the black diagonal.
Click to Enlarge
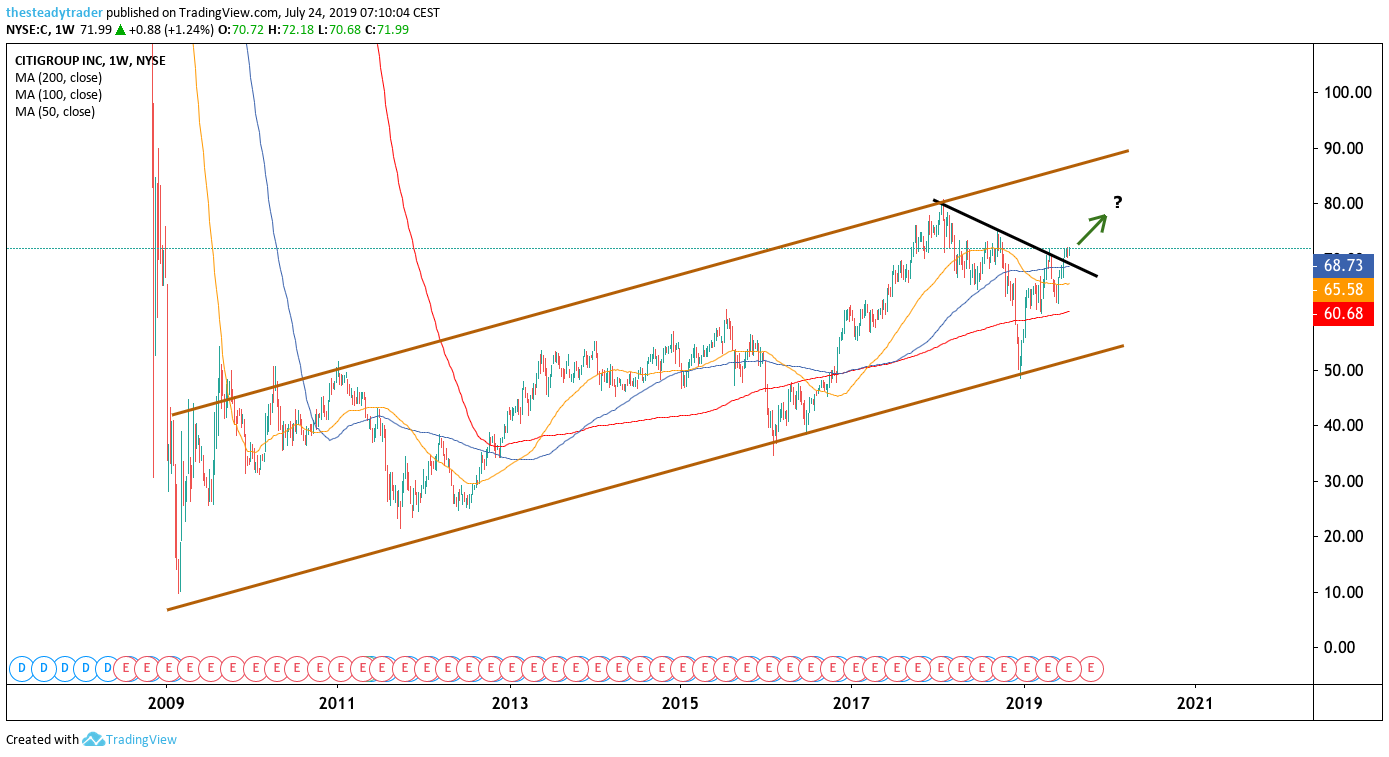
On the multi-year weekly chart of Citigroup stock itself we see that it has has ascended in a well-defined channel over the years.
Most recently, in January 2018, the upper end of the channel was hit and in December 2018, the lower end was tested. Currently, C stock trades roughly in the middle of the channel and recently broke out past the black diagonal resistance line.
A simple upside target — albeit a bit greedy for the time being — would be the upper end of the channel around the high $80’s.
Click to Enlarge
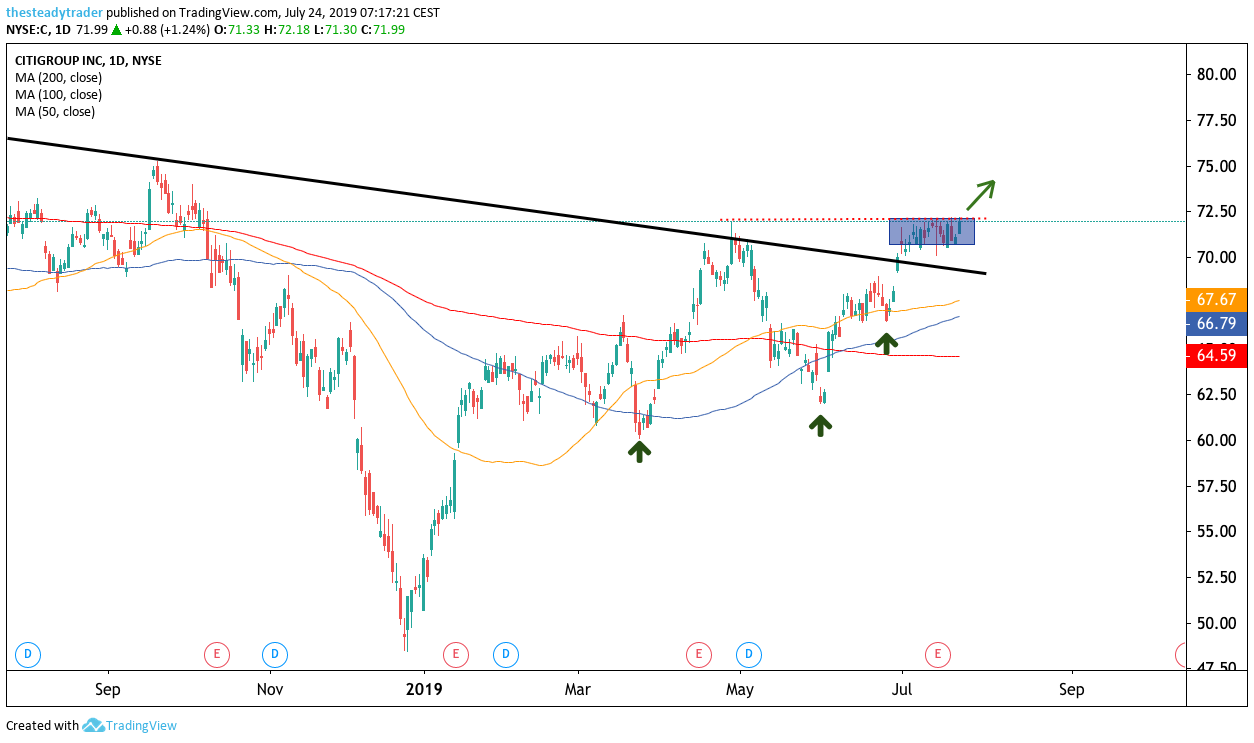
On the daily chart we see that C stock, since late December 2018, has traced out a clear series of higher lows (green arrows). In June, this led C stock to break out past diagonal and horizontal technical resistance. Over the past few weeks, the stock has largely been consolidating in a tight range, which given the aforementioned trends, now looks to resolve to the upside for a trade.
While trades at this juncture could look to buy C stock around the $72 area with a next upside target at $75 and a stop loss level at $70, there is a higher probability to structure a trade in this stock here. Myself and my clients prefer to structure a trade in the highest probability manner, which, in this case, means selling a very specific options spread.
In order to teach this special options trade I am holding a webinar for InvestorPlace readers on Thursday July 25. Register here.
Join Serge in an exclusive live webinar: The steady income options strategy. Register HERE. As of this writing, he did not hold a position in any of the aforementioned securities.