
Panic, run for the hills, sell everything! Actually, there’s no need to do any of that. Microsoft (NASDAQ:MSFT) stock fell from its peak price, but this is a normal and healthy pullback. Besides, Microsoft technical analysis clearly indicates that the stock isn’t in any real danger of collapsing.
To recap, Microsoft released its fourth-quarter fiscal 2024 results on July 30. The company beat Wall Street’s consensus revenue and EPS forecasts, but not by much. Furthermore, as Microsoft spent a boatload of money to compete in the artificial intelligence (AI) arena, the company’s Q4-2024 capital expenditure (capex) ballooned by more than 55% to a whopping $13.9 billion.
Still, the company managed to deliver Street-beating results and grew its quarterly revenue by 15% year over year, which is nothing to sneeze at. So, if you feel that Microsoft will weather the storm and the selloff was overdone, here are some key technical chart levels to keep an eye on.
Microsoft Stock: Moving Averages to Watch
Moving averages provide excellent guidelines for technical analysis. It might feel like the sky is falling, but moving averages can put investors’ fears into perspective.
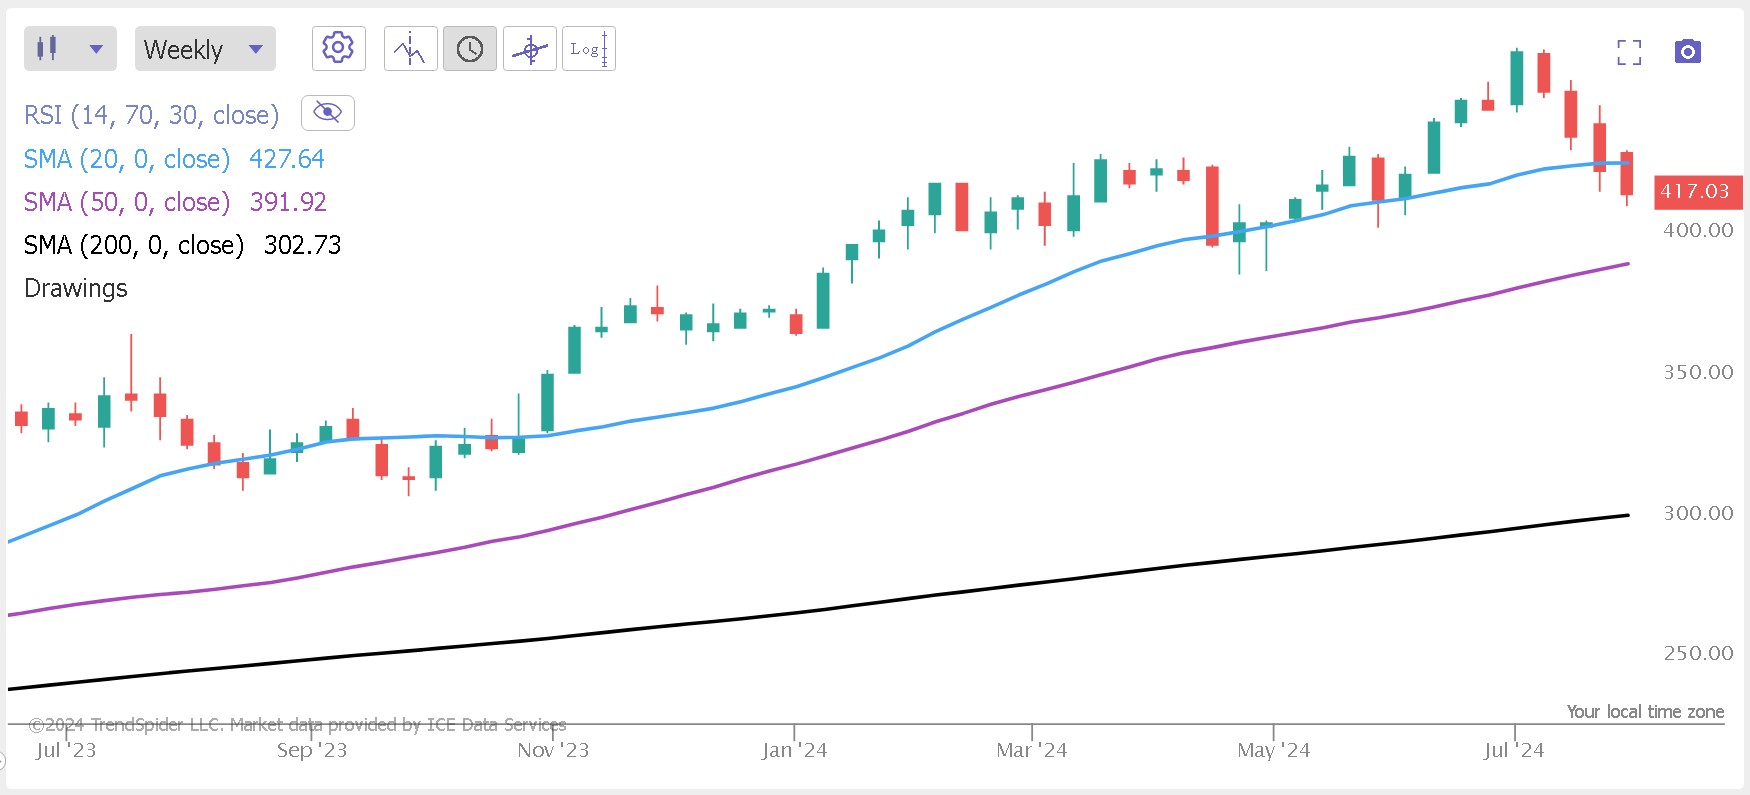
Here’s a perfect example. This weekly candlestick chart shows that Microsoft stock recently fell below the 20-day moving average (shown in blue). Notice, however, that the stock has fallen below that moving average multiple times but then soon rebounded each time.
Besides, the 20-day moving average isn’t the ultimate “line in the sand.” It’s only a short-term moving average. The 50-day moving average (shown in purple) is a medium-term moving average, and the 200-day moving average (shown in black) is a long-term moving average.
Microsoft stock is still comfortably above the 50-day and 200-day moving averages. So, the sky isn’t falling and Microsoft’s investors don’t need to panic.
Microsoft Is in the Loading Zone
Not only is there no need to panic, but there’s a good opportunity to load up on Microsoft shares. A popular technical indicator called the Relative Strength Index or RSI will prove this point.
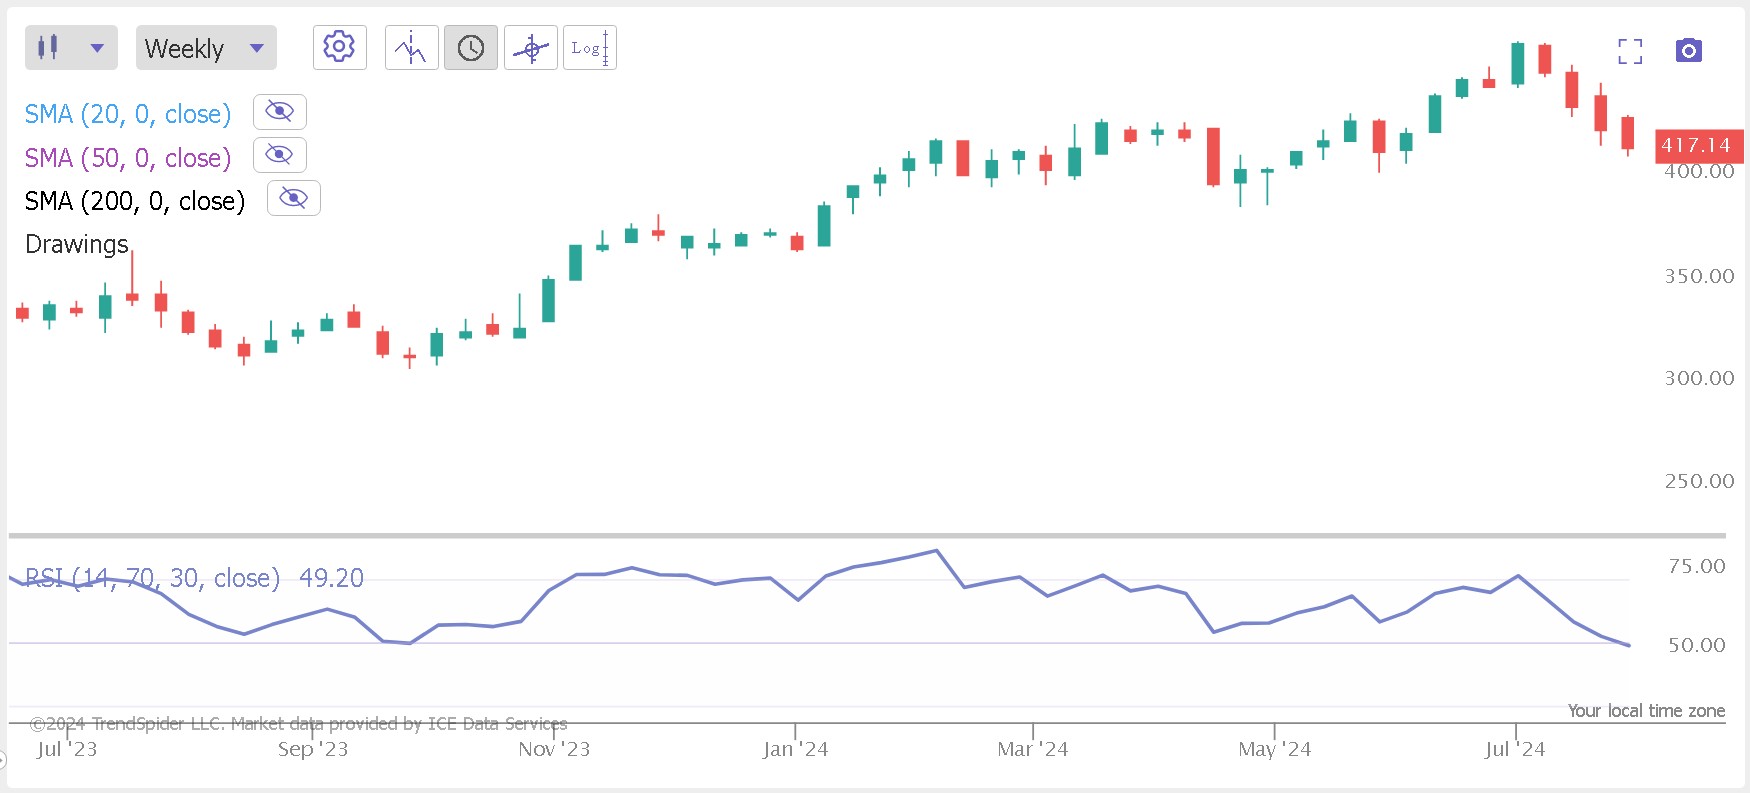
The RSI for Microsoft stock recently came down to the 50 area. This proved to be a significant bounce point in September of last year. It didn’t necessarily indicate oversold conditions for the stock, but we can see that the buyers regained control when the RSI hit 50.
In other words, we’re in the loading zone and it’s a good time to start dip-buying Microsoft shares. There’s no guarantee that history will repeat, but if you expect Microsoft to survive and thrive, then you now have a prime buying opportunity.
Microsoft Technical Analysis: Seize the Moment!
Every company goes out of favor from time to time – even the juggernaut Microsoft. Some simple charts show that Microsoft’s shareholders aren’t in any major trouble, and they generally win in the end.
It’s a textbook example of how Microsoft technical analysis can keep you calm and show you the buying opportunities. So, just relax and consider buying Microsoft stock while it’s still in the loading zone.
On the date of publication, David Moadel did not have (either directly or indirectly) any positions in the securities mentioned in this article. The opinions expressed in this article are those of the writer, subject to the InvestorPlace.com Publishing Guidelines.
On the date of publication, the responsible editor did not have (either directly or indirectly) any positions in the securities mentioned in this article.