
Square Inc (NYSE:SQ) dazzled investors Monday by scoring yet another new all-time high. After briefly flirting with $24, SQ stock settled back to a record close of $23.39.
 It’s turning into a banner year for the up-and-coming mobile payment company. Spectators unimpressed by the record highs should take a look at the stock’s year-to-date gains. Square is up a barn-burning 72%!
Improving fundamentals have contributed to the stock’s meteoric ascent. The past two earnings announcement were cheered by investors delivering twin up-gaps to Square’s share price. Last quarter marked a milestone for the stock as well. It was the first time the company garnered positive earnings per share since going public in late-2015. Square posted an EPS of 5 cents in arguably its best showing yet.
On the technical front, SQ stock is firing on all cylinders.
Square’s Stock Charts
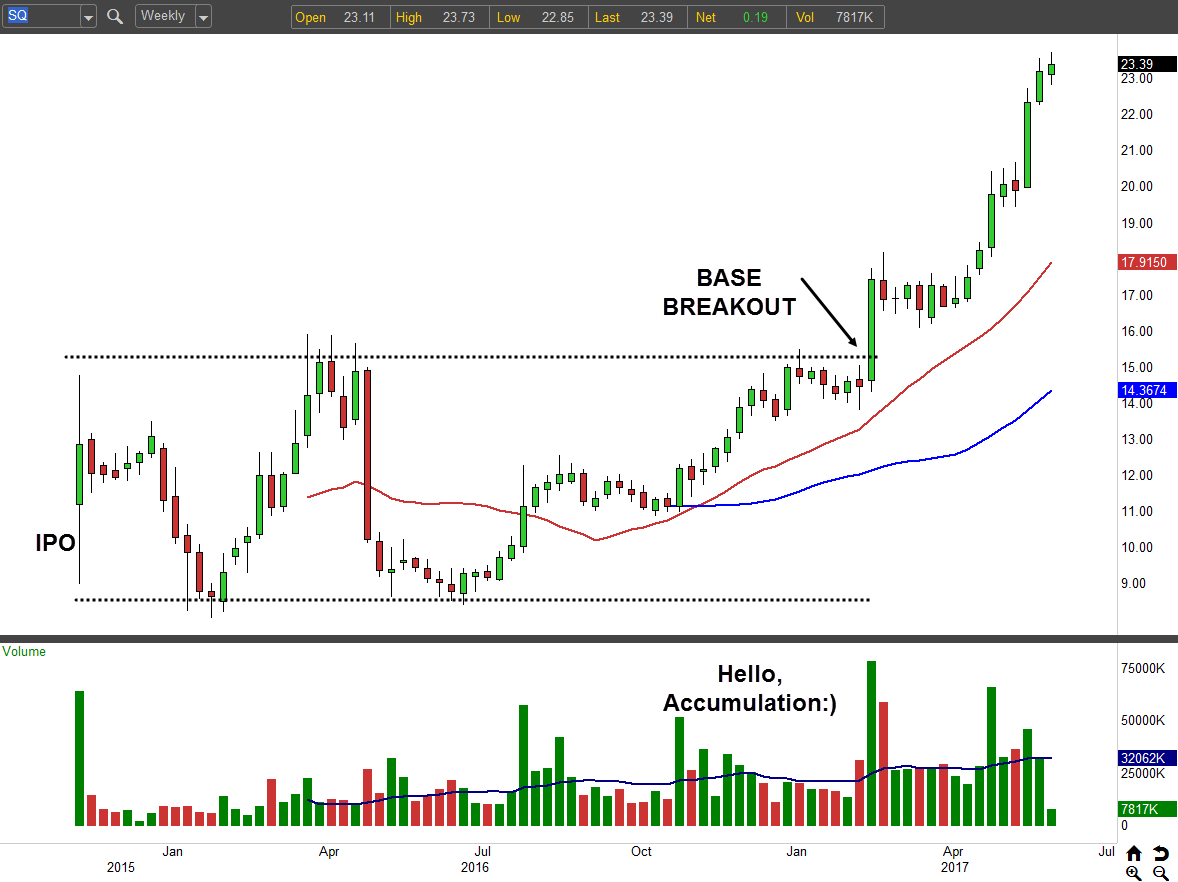
Perhaps the most significant development this year was the breakout from Square’s post-IPO base that transpired in February. This type of pattern has a rich history of launching many a new stock into the stratosphere.
Facebook Inc (NASDAQ:FB) is probably the best example in recent memory. Since February’s earning-induced launch, Square has scored an endless stream of new highs.
Click to Enlarge
And just look at that accumulation! It’s enough to make even the biggest Square bear impressed. There is no doubt institutions have been in buying mode over the past year. SQ shares have been added to portfolios with aggression.
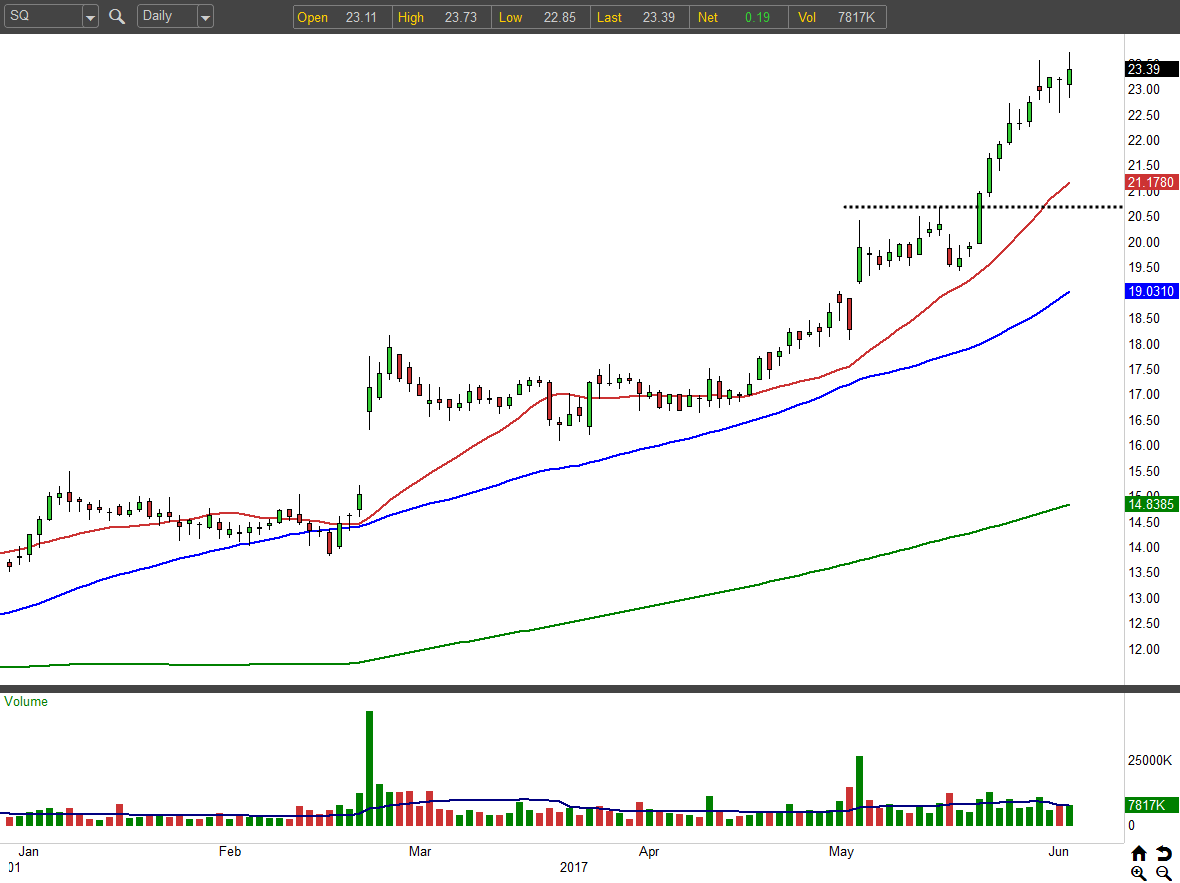
The momentum of the daily chart is scorching, to be sure. But, SQ’s parabolic posture suggests the rate of ascent is unsustainable. Heck, the stock is up almost 20% in the past two weeks alone. Just look at how that 20-day moving average (red line) is starting to peel away from the slower moving 50-day MA. ‘Tis a thing of beauty.
If and when a pullback strikes, look for the stock to retrace back to the $21 zone. That will be the idea level to launch new bullish trades from.
Click to Enlarge
The 20-day moving average, as well as prior resistance, both rest in that area (really $20.50 to $21), so that’s the most logical spot for buyers to step up and defend.
If you simply can’t help but chase here, despite the stock’s overbought status, then I suggest at least scaling in. That is, buy a partial position, but keep some of your powder dry. That way if profit-taking strikes in the coming days you’ll be able to buy the rest of the position at lower prices.
Get Paid for Discount Shopping in SQ Stock
Or, better yet, why not get paid for your willingness to buy the stock at lower prices?
You could sell the Jul $22 put for around 60 cents. If the stock remains above $21 by July expiration, the put will expire worthless, allowing you to pocket the 60 cents. Since the initial margin requirement should be less than $600, this will result in a solid 10% return on investment.
Alternatively, if SQ stock falls below $21, you will be obligated to buy 100 shares for each contract sold at an effective purchase price of $21.40 ($22 – $0.60).
Shorting puts admittedly will be a more attractive proposition if we can get at least a few down days in SQ first.
As of this writing, Tyler Craig did not hold a position in any of the aforementioned securities.