

Stage 1: Consolidation
As exciting as it can be to watch top-performing stock and cryptos ring up gains, they actually spend a lot of time moving sideways. During these periods – called consolidation stages – not much happens in the stock. A consolidation stage is characterized by sideways movement in the stock price, as seen in the chart of Apple (AAPL) below. The highlighted area is a consolidation stage.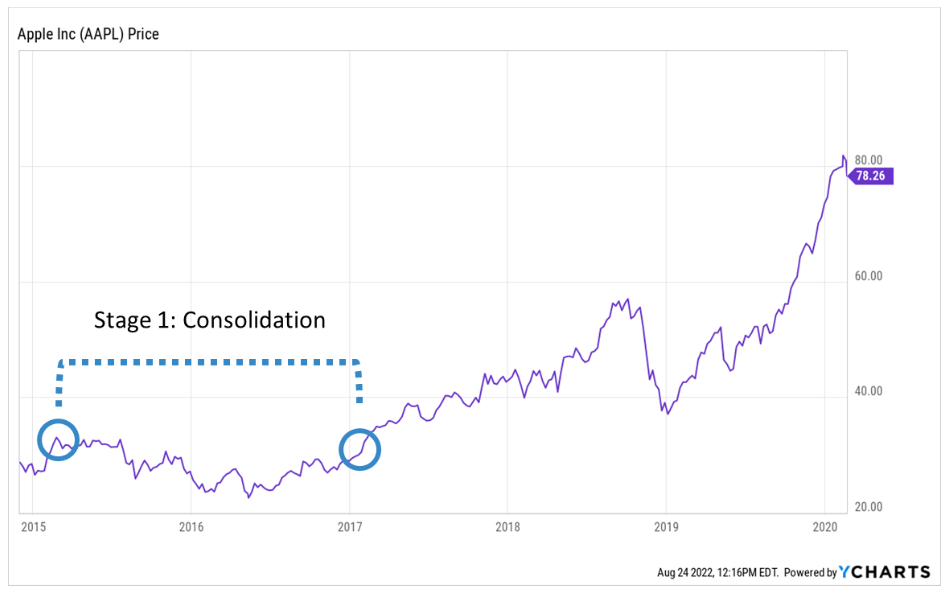 The lack of a stock’s forward movement during this stage can be caused by a variety of things…
The broad market may be struggling.
Maybe the company missed a lofty quarterly earnings target set by Wall Street analysts.
It might be that the stock is “digesting” gains produced during a big price run.
Whatever the reason, the asset makes no headway during a consolidation stage. There’s no upward momentum.
If you’re looking to trade stocks or cryptos for short-term gains, you should avoid buying when they’re locked in a consolidation stage. Instead, you should wait for them to enter Stage 2.
The lack of a stock’s forward movement during this stage can be caused by a variety of things…
The broad market may be struggling.
Maybe the company missed a lofty quarterly earnings target set by Wall Street analysts.
It might be that the stock is “digesting” gains produced during a big price run.
Whatever the reason, the asset makes no headway during a consolidation stage. There’s no upward momentum.
If you’re looking to trade stocks or cryptos for short-term gains, you should avoid buying when they’re locked in a consolidation stage. Instead, you should wait for them to enter Stage 2.
Stage 2: Breakout
A consolidation stage can last for months or years. But eventually, every great top-performing business generates such fantastic revenue and/or earnings growth that the world takes notice. Large money managers learn about the company, its growth, and its huge future potential. And they begin buying shares… often by the millions. The same goes for cryptos. A great project has some major breakthrough. Investors take notice, and they pile into the token. All this buying generates what we call an “upside breakout.” This is when an asset reaches a new high price. The price literally “breaks out” of its sideways pattern. You can see how Apple broke out of its consolidation stage in the chart below.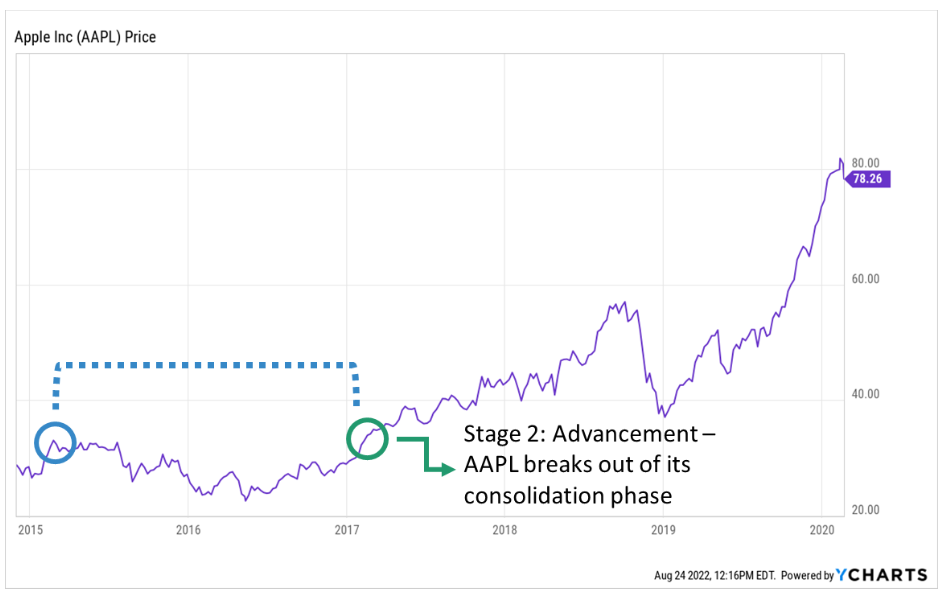 Stage-2 advancements are almost always characterized by a surge in trading volume. This is because more and more investors learn about the company, and they buy shares.
The increased buying power sends the stock even higher. This makes more people notice the stock or crypto to buy, which sends the price even higher… which makes more people notice… and so on.
The asset enters a self-reinforcing “rally cycle.”
Buying begets more buying.
It’s a beautiful thing.
A Stage-2 rally can be kicked off by a variety of things – an incredible quarterly earnings report, news of a product breakthrough, excellent clinical trials results, or a positive report from an influential investor.
And this kind of rally can last for months, even a few years.
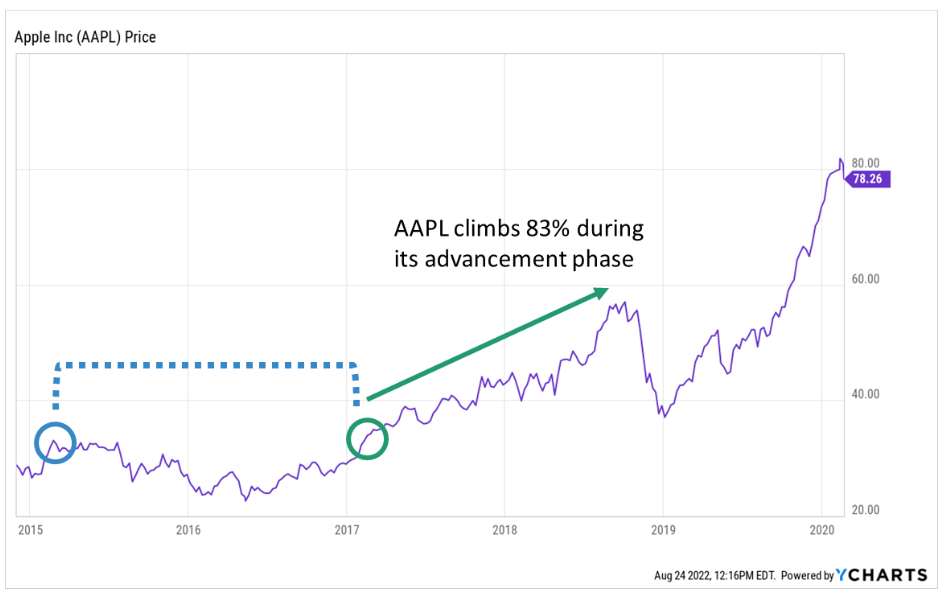
It’s not uncommon for top growth stocks to double or triple in value in less than a year during Stage-2 advancements.
Occasionally, stocks climb four, five, six, even 10-fold. Top cryptos can even soar 10X in less than a year during Stage-2 breakouts.
Let’s return to the Apple example we’ve been working with. That stock soared 83% in less than two years.
Stage-2 advancements are almost always characterized by a surge in trading volume. This is because more and more investors learn about the company, and they buy shares.
The increased buying power sends the stock even higher. This makes more people notice the stock or crypto to buy, which sends the price even higher… which makes more people notice… and so on.
The asset enters a self-reinforcing “rally cycle.”
Buying begets more buying.
It’s a beautiful thing.
A Stage-2 rally can be kicked off by a variety of things – an incredible quarterly earnings report, news of a product breakthrough, excellent clinical trials results, or a positive report from an influential investor.
And this kind of rally can last for months, even a few years.
It’s not uncommon for top growth stocks to double or triple in value in less than a year during Stage-2 advancements.
Occasionally, stocks climb four, five, six, even 10-fold. Top cryptos can even soar 10X in less than a year during Stage-2 breakouts.
Let’s return to the Apple example we’ve been working with. That stock soared 83% in less than two years.
Stage 3: Distribution
Now, no party lasts forever. Eventually, every super-performing stock or run-away crypto experiences a correction… a period of declining prices. And as with other stages, this can be caused by a variety of things… A decline in the broad market… A serious but solvable problem at the company… Or maybe investors just bid the company’s shares to very high valuations, and the stock needs to “take a breather” and return to more rational levels. But before a correction takes hold, stocks and cryptos typically experience what’s called a distribution stage. This is a period when investors and traders who bought shares before the rally sell their positions and take profits. They sell to less-informed investors who are arriving late to the party. You can see Apple’s distribution stage below.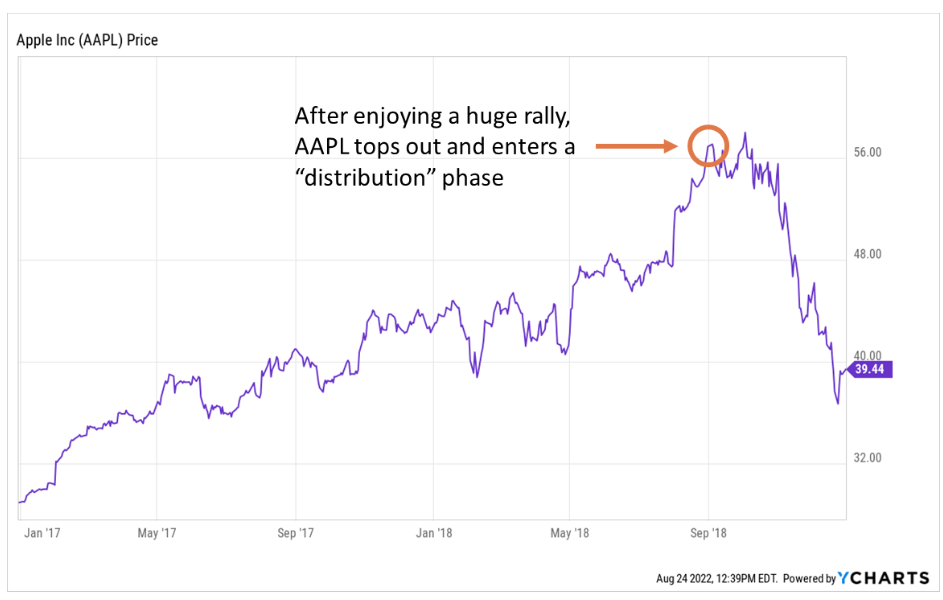 During this Stage 3, the asset is no longer soaring.
It typically trades in a sideways-to-lower pattern. This reflects the push and pull of investors who are sitting on big profits and selling to new investors who, again, are late to the party.
The Stage-2 buying frenzy marked a generally steady rise in prices. But the Stage 3 distribution period is characterized by a trading channel.
And then, the stock or crypto enters a correction.
During this Stage 3, the asset is no longer soaring.
It typically trades in a sideways-to-lower pattern. This reflects the push and pull of investors who are sitting on big profits and selling to new investors who, again, are late to the party.
The Stage-2 buying frenzy marked a generally steady rise in prices. But the Stage 3 distribution period is characterized by a trading channel.
And then, the stock or crypto enters a correction.
Stage 4: Correction
This is the least-enjoyable part of a top-performing asset’s life cycle. This stage is sort of like the hangover after a party. As I mentioned earlier, no asset – no matter how great – goes up every day, every week, every year. The market tends to go wild for elite stocks and cryptos and bids them up to unsustainable levels. Investors will bid to levels that the fundamentals don’t currently justify. Stage-4 corrections act to “wash away” the excesses and set realistic expectations. Here’s Apple’s correction in late 2018.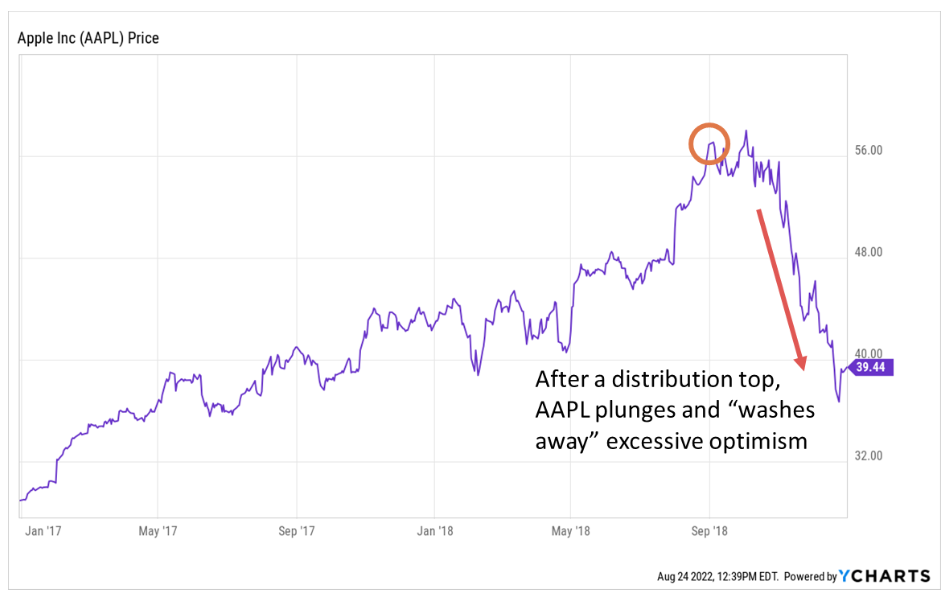 Stage-4 corrections can come in different shapes and sizes. Assets can correct 20%, 30%, 40%, even 60% from their highs. And these corrections can last months or even years.
After Stage 4, top growth stocks and cryptos return to Stage 1, the consolidation stage.
They “lick their wounds” and spend some time trading sideways.
During this consolidation, they continue to register increasing revenues and/or earnings. They build up power for their next leg higher.
Thanks to their growing businesses and now-lower share prices, they often sport attractive valuations… which allows us to make money in the next Stage 2.
Stage-4 corrections can come in different shapes and sizes. Assets can correct 20%, 30%, 40%, even 60% from their highs. And these corrections can last months or even years.
After Stage 4, top growth stocks and cryptos return to Stage 1, the consolidation stage.
They “lick their wounds” and spend some time trading sideways.
During this consolidation, they continue to register increasing revenues and/or earnings. They build up power for their next leg higher.
Thanks to their growing businesses and now-lower share prices, they often sport attractive valuations… which allows us to make money in the next Stage 2.
Apple’s Long-Term Growth
The chart below shows the stock price of Apple from 2001 to early 2020. As you can see, Apple regularly cycled through periods of consolidation, advancement, distribution, and correction during its extraordinary run. And they produced returns of about 30,000%.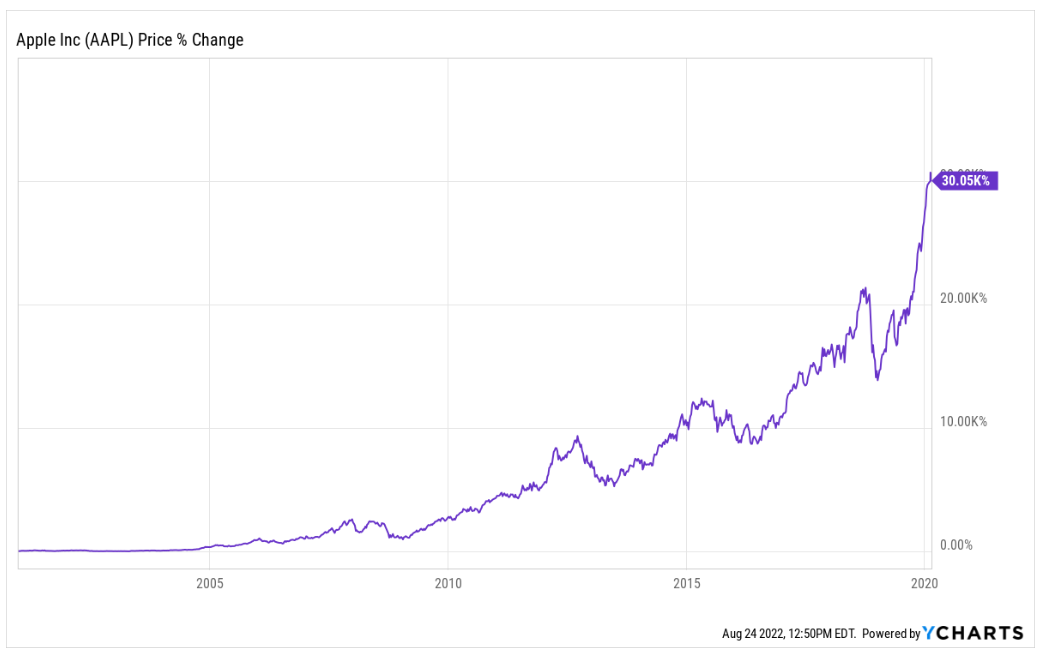 I’m a major proponent of long-term investing.
For people who don’t have the interest or time to follow the stock market every day or every week, it’s a great way to grow wealth.
As we’ve seen with Apple, you can make outstanding returns by holding a good stock through all its stages.
But if you’re interested in riding top assets for short- to medium-term profits while avoiding what can be substantial, painful drawdowns, the lesson is clear…
Restrict your buying only to stocks entering Stage 2!
I’m a major proponent of long-term investing.
For people who don’t have the interest or time to follow the stock market every day or every week, it’s a great way to grow wealth.
As we’ve seen with Apple, you can make outstanding returns by holding a good stock through all its stages.
But if you’re interested in riding top assets for short- to medium-term profits while avoiding what can be substantial, painful drawdowns, the lesson is clear…
Restrict your buying only to stocks entering Stage 2!
The Final Word on Our Next-Gen AI Trading System
Like many of you, we have always been fascinated by the potential of data analytics in the investing sphere. The emergence of ChatGPT really put the power of AI in perspective for the rest of the world. But we have long sought to harness the power of artificial intelligence to outperform the markets. That’s why our team of Caltech quants set out on a journey to make investing with AI a reality. Over the past few years, my team has developed a groundbreaking AI-powered trading system that applies quantitative stage analysis to every stock in the market. And we’ve scored some huge wins with this powerful tool. And to prepare for the Fourth Bitcoin Halving, we’ve tailored this system toward the crypto markets so we can identify the projects with the most explosive short-term upside potential. After all, history shows that the 12 months after a halving event are arguably the best opportunity investors have to make 10X returns in just a few months. And we’re at that point right now. The crypto markets are likely positioned to soar unimaginably over the next 12 months. Dozens of altcoins could soar 1,000%-plus in a hurry. If you’re interested in catching a ride on a few 10X cryptos, join in next Tuesday morning, April 23, at 10 a.m. Eastern, for our new quant system’s grand debut. Reserve your seat right now.On the date of publication, Luke Lango did not have (either directly or indirectly) any positions in the securities mentioned in this article.