

Editor’s Note: History doesn’t just repeat – it teaches.
The stock market quietly endured its sharpest single day drop since the Great Depression in 1962. That moment shaped a young investor named Stan Weinstein, leading him to uncover a timeless framework for spotting the hidden order behind major market moves.
His “Stage Analysis” remains one of the most powerful tools for timing entries, exits, and avoiding costly missteps.
But now, our partners at TradeSmith have paired it with a modern, big-money tracking system that could help you capture the market’s most explosive phases.
Today, TradeSmith CEO Keith Kaplan is joining us today to share more…
In May 1962, Marilyn Monroe sang “Happy Birthday, Mr. President” to JFK at Madison Square Garden.
Scott Carpenter orbited the Earth aboard Aurora 7—becoming the second American, after John Glenn, to complete the trip.
And the name of a young singer, Bob Dylan, was just starting to spread through the New York folk scene.
It was also the month the U.S. stock market suffered its sharpest one-day drop since the Great Depression.
That plunge is largely forgotten now.
But on May 28, the S&P 500 dropped 6%. It was the worst day of a bear market known as the “Kennedy Slide.”
Between December 1961 and June 1962, it took the S&P 500 down 28%. Panic swept through Wall Street. Newspapers warned of a new depression. Investors lost their shirts.
Legendary technical analyst and author Stan Weinstein remembers it well.
Although still a teenager, he’d begun investing based on “safe picks” from leading newsletters. During the crash, those picks collapsed. He watched helpless as his portfolio unraveled—and with it his confidence in the old rules.
But it wasn’t all bad news.
The experience led him to discover one of the most powerful frameworks in modern technical analysis—what he called Stage Analysis.
And if you have money in the markets, it needs to be on your radar.
It doesn’t just give you a repeatable system to time entries and exits. It helps you avoid chasing headlines and false signals—by clarifying when a stock is entering a powerful breakout phase.
In fact, according to Weinstein, it’s the hidden order behind all major stock moves.
That’s why we’ve built Weinstein’s insight right into one of our most powerful software tools.
Already, we’ve used it to spot the following gains…
On Thursday, August 14, I’ll show you how we’ve combined stage analysis with a breakthrough system from a Wall Street trader who regularly executed trades worth $1 billion and up.
First, it’s important you understand how Weinstein’s insight works… and why it’s so powerful.
Law of Nature
Most people don’t know this, but at any given time, every stock in the market is in one of four distinct—and predictable—stages.
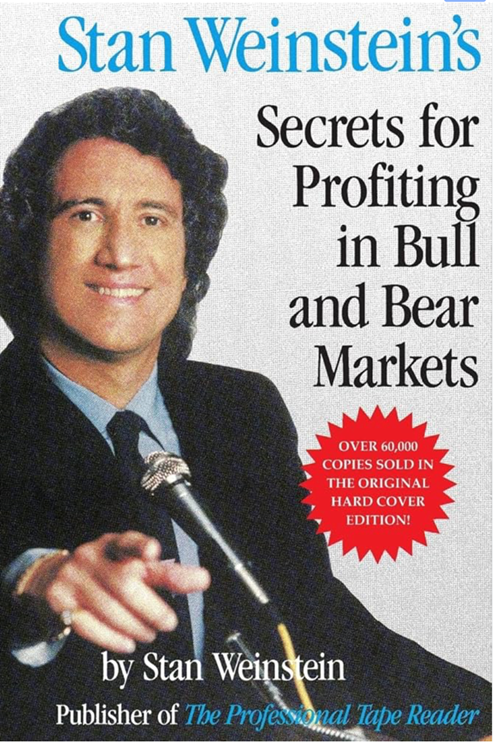
Weinstein laid it all out in his 1992 book, Secrets for Profiting in Bull and Bear Markets.
The original hardcover edition sold more than 60,000 copies. And it remains a cult classic. But it’s largely forgotten today.
That’s a pity. Because it details a four-stage method you can use to profitably trade stocks in any market condition.
It doesn’t matter what sector a stock is in. It doesn’t matter if it’s a $2 million startup… or a $4 trillion behemoth like Nvidia. Like a law of nature, all stocks—even entire stock market indexes—move through the same four stages.
To see them in action, here’s a chart of the tech-heavy Nasdaq from the early 1990s through the early 2000s.
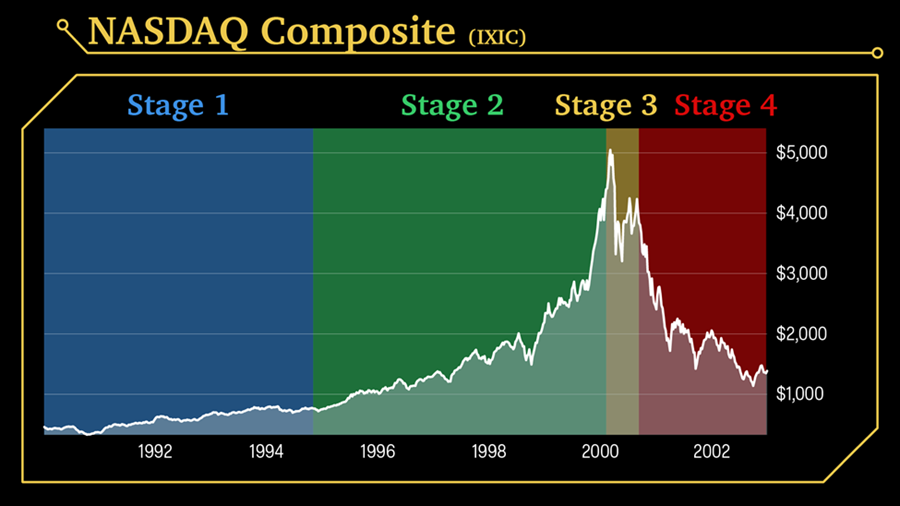
Over that time—which includes the inflating and bursting of the dot-com bubble—it went through all four stages.
From 1990 to 1995, the index was in Stage 1—known as the “Basing” or consolidation stage.
Valuations are attractive, but overall sentiment is still bearish. So, stocks remain in a narrow price range, up one week and down the next.
This stage can feel like no man’s land—stock prices bounce around aimlessly, often for months or even years.
And as you can see, after the 1990–91 recession, the Nasdaq spent years in slow, sideways consolidation.
But then you get the bullish Stage 2, which Weinstein called “Breakout & Uptrend.” Institutional money floods in. Stocks surge on volume, break out of the Stage 1 sideways trend, and sentiment shifts from negative to positive.
Pay attention. Because this is where the big money is made.
Buying Frenzy
Whether you realize it or not, most of your profits from stocks, are during Stage 2.
It’s a buying frenzy.
The Nasdaq entered Stage 2 in early 1995. From there, it marched higher for the next five years. This delivered gains of more than 500%.
Then you get Stage 3—the “Topping” stage. This happened in late 1999 and early 2000.
Finally, you get Stage 4—or “Downtrend.” Bullish momentum turns to bearish panic. Sellers take control.
This is the least enjoyable part of a stock’s life cycle. But eventually, selling pressure eases, the market re-enters Stage 1, and the cycle begins anew.
You don’t need to know all the details. Just know that the real money is made in Stage 2.
Once a stock leaves this stage, and enters Stage 3, you want to sell your shares and take your money off the table.
Just being able to spot which stage a stock is in can save you time, money, and a whole lot of frustration.
Of course, that’s easier said than done. But thanks to the help of a former Wall Street trader, it’s possible.
Don’t Fly Blind
He made partner at Wall Street firm Cantor Fitzgerald at the age of 28.
Cantor helps hedge funds, financial institutions, and other deep-pocketed investors execute multimillion-dollar trades.
By the time he was done on one giant trade, he’d bought about 7% of the company’s share float. And that wasn’t even a particularly big trade by his standards. He was one of the few guys at his firm who regularly executed trades worth $1 billion and up.
But 10 years ago, he quit his corporate job. And he developed a proprietary trading system based on what he learned executing Wall Street’s biggest trades.
It flags when big-money investors are placing the kind of multimillion-dollar bets he used to execute. And he’s partnered with TradeSmith to share his system with regular investors.
About 70% of all money flows in the market are from institutional investors. If you’re missing these signals, it’s like flying blind.
That’s why I’m so excited for my upcoming event. I’ll be sharing more details of that partnership… and how you can use our system to really move the needle on your wealth.
Here’s that link again to get access to our presentation and take his proprietary trading system for a test drive.
I’ll see you there!
Regards,
Keith Kaplan
CEO, TradeSmith
P.S. Is Wall Street money flowing in… or out…of your favorite stocks? Once you’re on our attendee list, you’ll get an “unlocked” version of our money flow tool. And you’ll be able to search by ticker symbol. Register now and check it out.