Retail earning season is hitting the market now as some of the larger brick-and-mortar companies provide quarterly results over the next week or so. This morning, results from Target Corporation (NYSE:TGT) will put it on the trader’s radar as well as Lowe’s Companies, Inc. (NYSE:LOW). The stocks are split this morning with one heading 8% higher and the other 1.4% lower. Both offering opportunities.
On the technology side, earnings results from Cisco Systems, Inc. (NASDAQ:CSCO) are due out after the close today, providing trading fodder for the technology sector, which has been struggling for the past few weeks. The charts on each of these are providing some clear trade opportunities for these late-season earnings companies.
Target Corporation (TGT)

Target’s numbers hit the tape just a few minutes ago. The company reported earnings results (PDF) that beat the Street’s expectations. At the same time, the company provided in-line earnings guidance along with raised guidance on the company’s sales expectations for the fourth quarter.
Shares are trading 8.6% higher on the positive earnings report, as they’re currently bid just under $78. The morning move took Target shares to chart resistance at the $76 level formed from the July/August highs. While this resistance provided a hurdle, it also showcased the resilience of the bulls to break a bearish trend.
Breaking above the $76 mark, TGT stock broke the trend of lower lows and lower highs that has been in place on the stock since shares tumbled in April. This move also put Target stock back into long-term bull mode, as shares retake its 20-month moving average. The return above the 20-month trendline will mark a similar pattern that Target shares saw in September 2014 when Target rallied back to new highs after spending almost a year in bear market mode.
For now, the charts favor the upside for Target shares. While the short term may see some selling pressure, it will serve best as buying opportunities for the stock.
Lowe’s Companies, Inc. (LOW)
Another retailer entering the earnings confessional this morning is Lowe’s. The home improvement center failed to beat expectations and lowered their expectations for the coming quarters. The news has disappointed investors, evidenced by the 6% decline in shares in pre-market trading.
Shares opened at $66.23 after closing the day at $69.05 last night. The $65 level proved a critical hold for Lowe’s shares, which threatened to drop deeper into bear market trading. After the market opened, however, Lowes managed to pare its loss to 1.6%.
The long-term monthly chart for Lowe’s shows the importance of the $65 level to hold over the next week, as this price has been supportive of the shares twice in the past two years. One key difference is the direction of a few key trendlines.
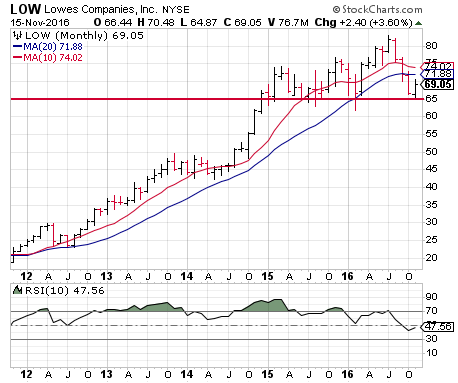
Click to Enlarge
These trends suggest that Lowe’s stock remains in play as a “sell the rally” stocks, something that is likely to change to “just sell the stock” as the $65 price level gives way. For those looking for the next level of support, start eyeing the $58.50 price level, about 15% from last night’s close.
Cisco Systems, Inc. (CSCO)
The networking giant will report earnings results this afternoon after the close. The past few days have seen buying ahead of the report as traders are buying the rumor on the shares. The company has strung together an impressive string of earnings beats over the past five years, though there are usually mixed results after these announcements.
Cisco’s relative strength in the market suggests that the stock may see some selling on a positive report, the number to watch will be the revenue and any positive guidance. A tick higher in the year-over-year revenue figures will get the Street into a buying mood as well as any positive comments in Cisco’s outlook.
Right now, support is in place at the $30.50 level from a confluence of the 20- and 100-day moving averages. This level will serve as a short-term firewall for shares if there is a slight miss. Following Cisco’s historical reaction and the recent strength, we’ll expect to see buyers come in at this level.
On a bad report, $28.50 will be the next level where significant buying should come in on Cisco shares. This is the site of the stock’s 20-month moving average, that line of demarcation between bull and bear market trends for a stock.
A positive earnings report will see the shares rally above the $32 price point, which will act as some resistance along with the $33.50 level. Watch for some profit-taking at these levels that will turn into a buying opportunity for the intermediate-term traders and investors.
As of this writing, Johnson Research Group did not hold a position in any of the aforementioned securities.