The market continues to point higher as this weekend’s tax talk has provided another round of bullish catalysts for stocks. The S&P 500’s break above the 2,300 level now has portfolio managers excited about a stronger-than-usual year. This means that we can expect to see a lot of momentum chasing as the quarter progresses.
Today’s three big stock charts look at Tesla Inc (NASDAQ:TSLA), Caterpillar Inc. (NYSE:CAT) and shares of Ford Motor Company (NYSE:F).
Tesla Inc (TSLA)

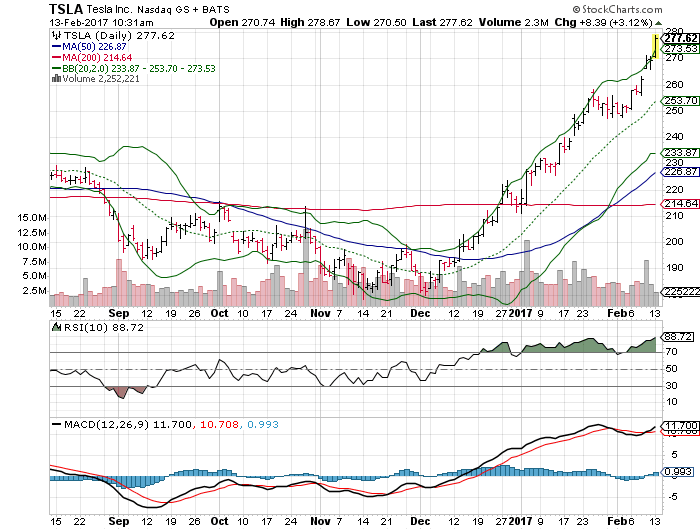
Rather than asking “How?”, investors and traders continue to focus on “What” Tesla and Elon Musk are producing. For years now, TSLA stock has encountered difficulties as the production capabilities of the company struggled to deliver on the ideas of its visionary.
The recent surge in Tesla’s share prices are telling us that this is no longer a concern. Today’s move higher breaks the top Bollinger Band for TSLA shares, again. This signals that we can expect to see another volatile move higher.
This comes as Tesla prepares to release its earnings announcement next week, on Feb. 22 after the market close. The volatility rally is likely to carry TSLA shares to $295 ahead of the earnings results, but we see some trouble there.
Tesla shares are well-known for their habit of following a “buy the rumor, sell the news” pattern around earnings and other news events. For this reason, we’re cautious.
Add to TSLA stock’s habit, the fact that shares are deep into overbought territory and the charts are indicating that the slightest hint of disappointment will cause a rush to the exit for traders and a rapid and volatile sell-off.
For now, allow the trend to be your friend until this stock reaches $295, but then take action to protect your profits ahead of earnings.
Caterpillar Inc. (CAT)
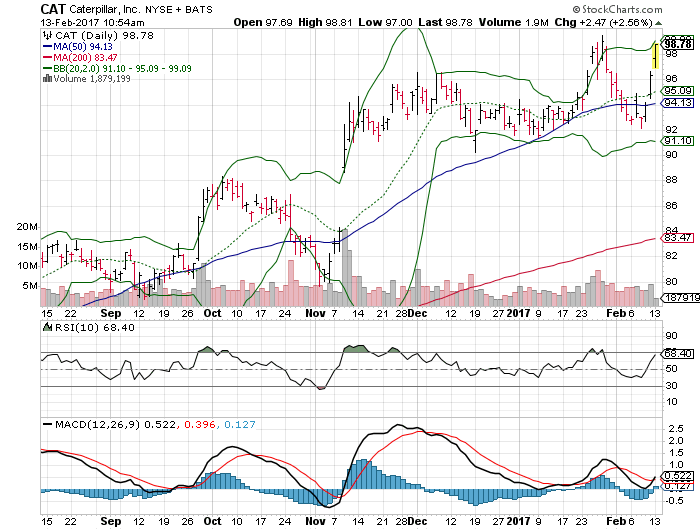
Shares of Caterpillar are seeing a transition in the stock price as the intermediate-term technicals are improving. Today, the 20-day moving average of CAT is moving above the 50-day, signaling an intermediate-term buy. Historically, Caterpillar stock’s daily performance strengthens after these signals.
In addition, Deere & Company (NYSE:DE) will report earnings later this week. The peer company has been performing well and expectations for their earnings are low. A beat on earnings for DE will give a boost to CAT shares as well.
Caterpillar shares are also moving into position to see two significant breaks. One, a move above the psychologically significant $100-price-level. Second, a potential break above CAT stock’s top Bollinger Band. The latter would increase buying interest and volume and cause a volatility rally towards $110.
Ford Motor Company (F)
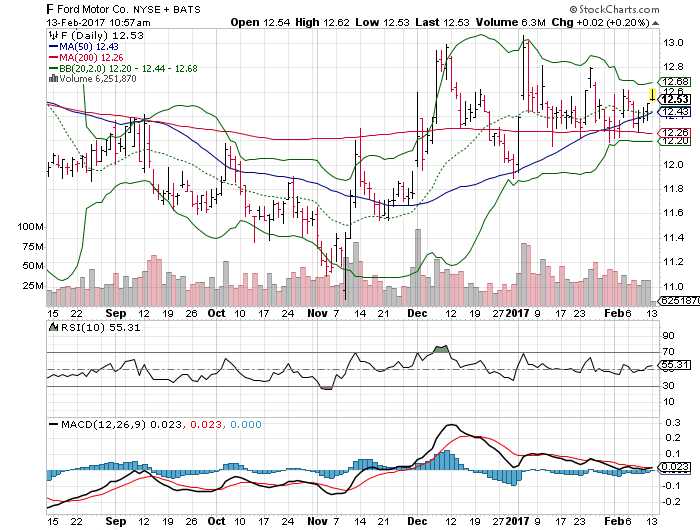
Automakers are in a rut of late as analysts are suggesting that demand for cars and trucks will decline. The affect has Ford shares lagging the market and only returning 8% over the last year. That said, there’s a potential trade in this laggard stock.
F shares have been consolidating for the last month as the rest of the market has found strength to rally. Thus, Ford stock is seeing a squeeze play that is going to move Ford 5-10 percent higher or lower in the next few weeks.
As of today, Ford shares are sitting at the confluence of technical support created by their 50- and 200-day moving averages. Failure to hold above both of these trendlines will cause the technical traders to start hitting the “sell” button and target a move to $11.50, an 8% decline from F stock’s current levels.
The other outcome: Support at $12.50 from these critical trendlines holds and Ford stock kicks into catch up mode as traders begin to migrate into this technical move. This outcome holds a 6% upside for F stock with a target of $13.25 per share.
Given the slightly positive momentum for Ford shares, we see the likelihood of the bullish scenario playing out, but over the intermediate-term outlook, this rally will more likely be an opportunity to sell into strength as the automaker is likely to continue to lag the market through 2017.
As of this writing, Johnson Research Group did not hold a position in any of the aforementioned securities.