Holiday fireworks didn’t just inspire patriotism among the denizens of the Street; it also kicked off a buying binge centered in technology stocks. Wednesday’s pop in the Nasdaq Composite offered a well-deserved reprieve to traders tiring of the incessant weakness in all things tech. Semiconductors led the charge reversing multiple days of losses with Advanced Micro Devices, Inc. (NASDAQ:AMD) soaring 8.6% on the day. But do you know which tech stock is really tantalizing here? It’s Alibaba Group Holding Ltd (NYSE:BABA) — here’s why.
 BABA boasts relative strength in spades, it has one of the cleanest uptrends in the entire market and it’s oh-so-close to breaking out to yet another all-time high. Let’s unpack each item to appreciate fully the technicals underlying today’s trade idea.
BABA Stock Charts
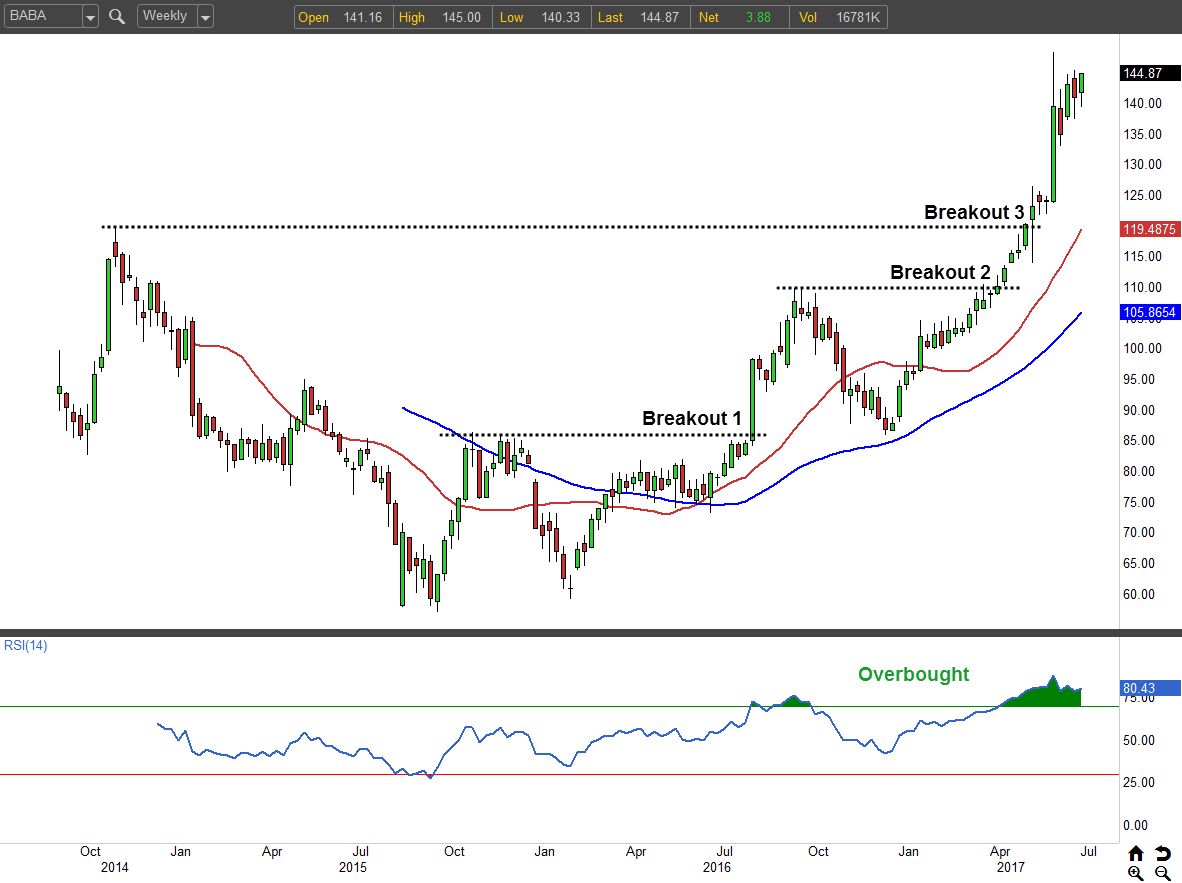
Let’s begin with a look at the weekly chart. At $144.87, Alibaba shares have climbed 65% year-to-date. The gains have come amid a one-sided bullish onslaught. Of the 27 weekly candles we’ve seen so far this year, BABA has only registered six down candles. And three of those were barely down.
The ascent has carried BABA to record heights and momentum has only accelerated. While some may cite the overbought RSI readings as a concern, I suggest a more optimistic takeaway. Alibaba first flashed an overbought signal in April and has since added 30% to its gains. It’s evident that buyers are giving little regard to the stock’s extended status. And there isn’t any reason why it can’t remain overbought for weeks to come. Plus, as we’ll see on the daily chart, Alibaba has actually paused for the past month so while the weekly time frame is overbought, the daily isn’t.
Click to Enlarge
Another noteworthy observation is the consistency with which breakouts have delivered big gains for Alibaba shareholders. Nothing gets spectators itching for involvement like finally taking out a clear resistance level. I suspect the same principle will prove true for the imminent breakout on the daily chart.
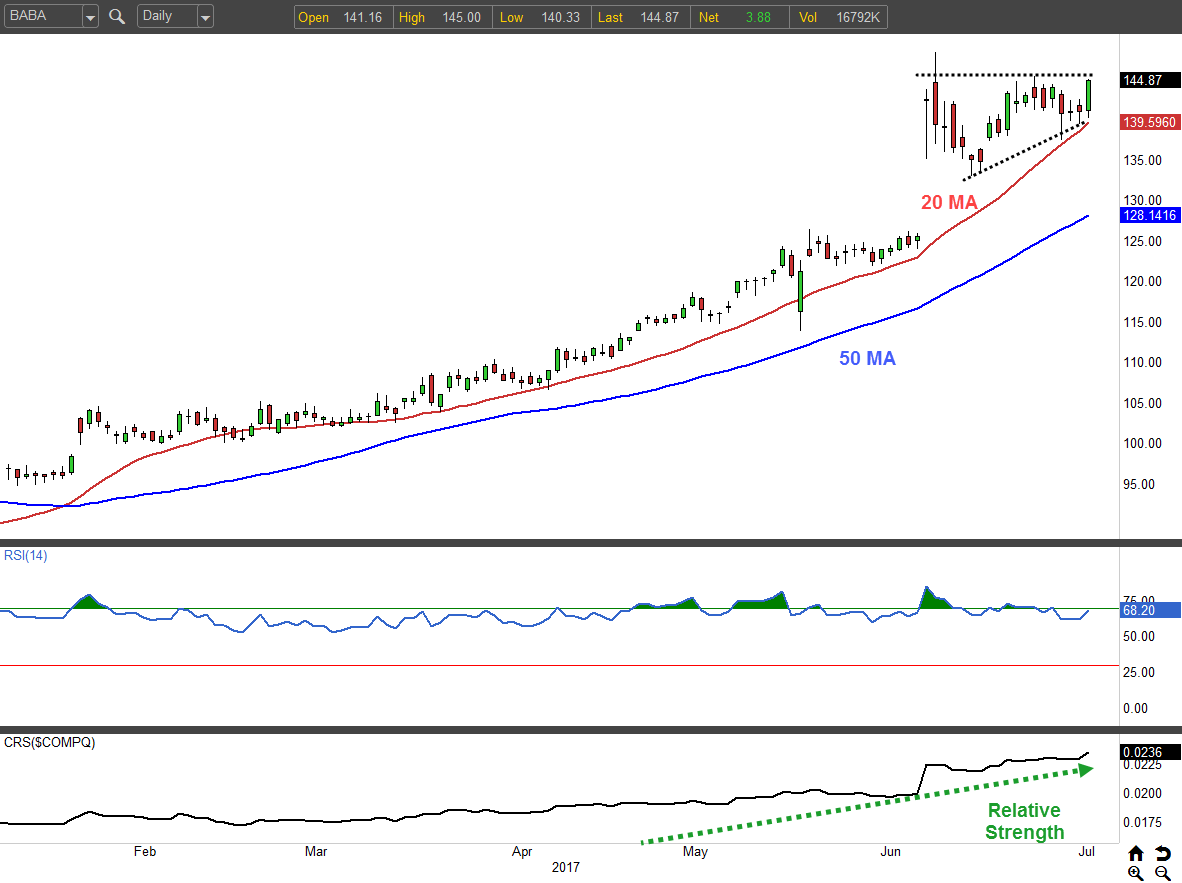
For the daily BABA stock chart, I’ve added the Comparative Relative Strength indicator (CRS) which shows the company has been beating the pants off of the Nasdaq for the entire year. There’s no doubt it’s a leading stock in what has been a leading sector. The simple comparison of how Alibaba has performed during the recent tech wreck speaks volume.
While the Nasdaq cratered beneath multiple support levels and its 50-day moving average, BABA has remained aloft.
And just look at how that RSI keeps hugging the overbought zone. Buying pressure has kept pullbacks shallow and short-lived, just like shareholders like ’em.
Click to Enlarge
Pattern-wise, the stock has developed an ascending triangle since gapping up early last month. And with Wednesday’s strong bullish candle, it appears the resistance zone at $145.60 is about to give way.
The BABA Trade
With July expiration fast approaching, it’s difficult to structure any kind of play using July options. So, we’ll turn to the August cycle, which has 44 days remaining to structure our trade. To exploit the higher rate of time decay as well as create a high probability of profit, sell the Aug $135/$130 bull put spread for $1.13.
The short vertical consists of selling to open the $135 put, while buying to open the $130 put. The max reward is limited to the initial $1.13 and will be captured if BABA sits above $135 at expiration. However, since earnings are scheduled for Aug. 10, I suggest exiting earlier if you can buy back the spread for 50 cents or less.
The max loss is limited to $3.87, but you can minimize the damage by simply exiting if the stock falls below support at $132.75.
At the time of this writing, Tyler Craig held bullish positions in BABA.