What’s in store for high-definition, video chip manufacturer Ambarella Inc (NASDAQ:AMBA) when it reports earnings Thursday night? We’ll take a look at recent announcements, the AMBA stock chart and what, if anything, the options market is suggesting for bulls, bears and agnostics alike.
 Ahead of Ambarella’s third-quarter earnings release, analysts are forecasting profits of 95 cents per share. That’s a 12% decline from the year-ago period’s $1.08.
Meanwhile, AMBA revenues are expected to nudge higher and grow by 4.8% to $97.7 million compared to 2015’s sales of $93.2 million. Sequentially, Ambarella is set to show a huge improvement over last quarter’s $65.1 million. That sounds like good news.
The better news for AMBA stock holders is revenues are set to grow to their highest levels in Ambarella’s history as a publicly traded company.
The sales traction is a positive sign that AMBA is having continued success decoupling away from its largest and embattled customer GoPro Inc (NASDAQ:GPRO) and moving into growing markets such as consumer IP security.
For its part, analysts at Stifel estimate revenues attributed to GoPro will drop from roughly 26% in 2016 to 10% for Ambarella by next year. And broker Pacific Crest is bullish longer-term thank to Ambarella’s secular growth exposure and cost profile. AMBA believes the combination can help the company recapture sustainable 20% plus growth.
Ambarella has established a strong pattern of beating Street profit views. In fact, over the past couple years, the company has topped estimates 100% of the time and typically by a wide margin of 15% to 20%.
Ambarella Stock Short-Term Trading Record
Unfortunately, investor reaction in AMBA stock has proven a bit spottier. Ambarella has seen price declines in four of the past six announcements in the immediate aftermath of releasing its earnings.
Working backwards, AMBA shares have moved -6.67%, 9.39%, -8.93%, -1.64%, -8.51% and 3.74% on a close-to-close basis following its announcement.
Overall investor reaction in Ambarella stock has resulted in an average decline of -2.10% by the close of business the next trading day. Variability of 7.41% based on a one-standard-deviation reading yields an estimated range of -9.51% to 5.31%.
AMBA’s seven-day stock performance reflects more of a coin toss, with an average gain of just 1.23%. But don’t let the muted price action fool you. Ambarella stock’s variability for that same period comes in at a hefty and volatile 18.73%.
AMBA Stock Chart
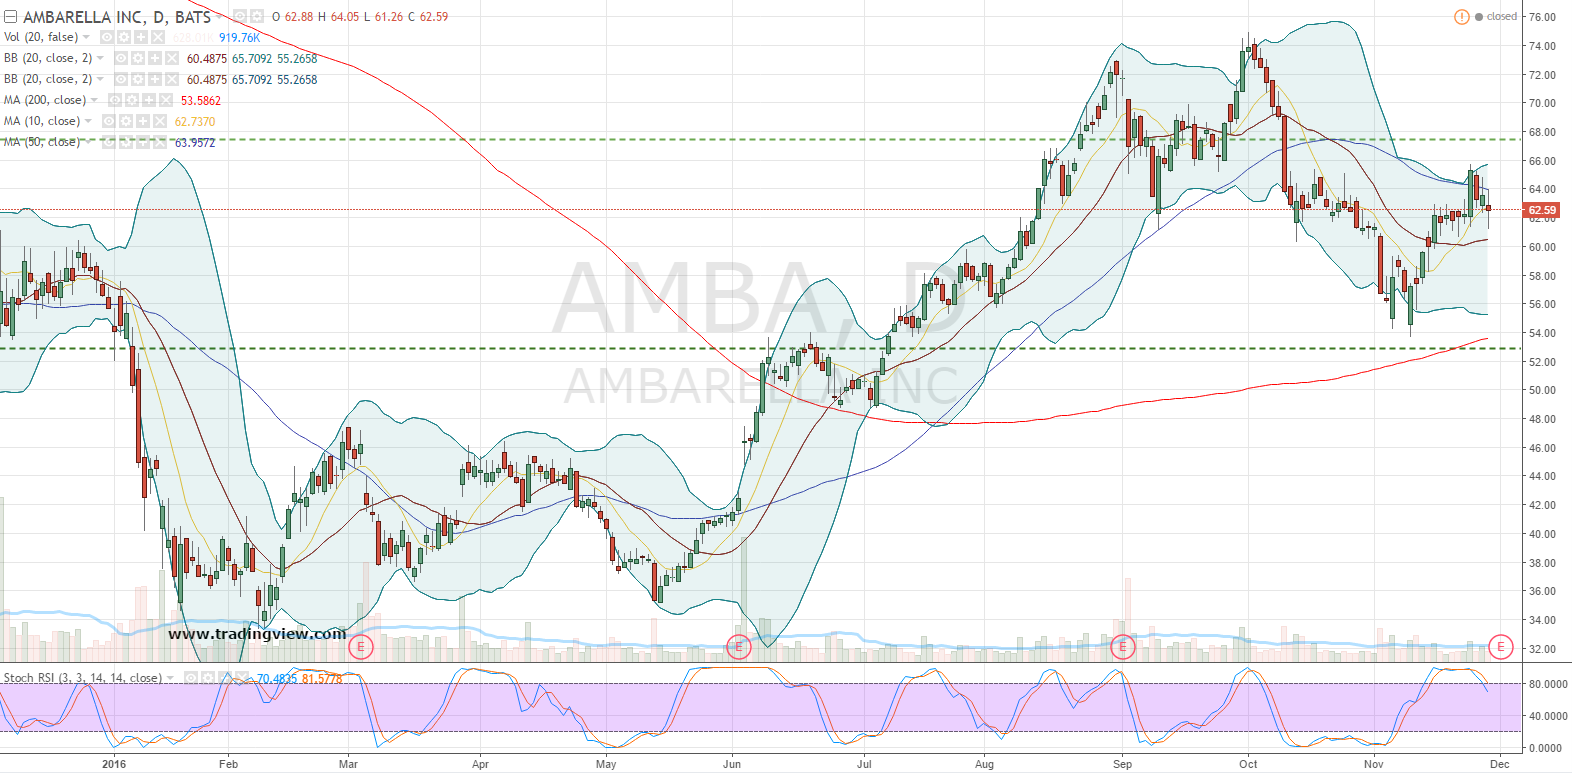
Click to Enlarge
After skyrocketing higher from mid-2014 to mid-2015, Ambarella stock plunged by approximately 75% over the next year-and-a-half before confirming a double-bottom pattern in May of this year.
After more than doubling from its technical low, AMBA stock has put together a corrective move of 28% from October into early November. The constructive price activity also established a successful test of 200-day simple moving average support.
Net-net, AMBA’s price action is consistent with more volatile growth stocks. As much, it’s viewed favorably despite a bit of current short-term price weakness after shares tested the 50-day SMA.
How to Trade AMBA Stock
In Tuesday’s trading session, activity in Ambarella’s options was very quiet with nary a clue from potential investors.
Behind the scenes, implied and underlying volatility in AMBA stock have been trending mostly higher, together, over the past several weeks. Option premiums are in the low end of this year’s trading range, but bid above the most recent earnings event.
The weekly Dec. 2 $62.50 straddle market points to a 68% chance that Ambarella stock will remain within an approximate price range from $57.25 to $67.75 through Friday’s expiration. The math behind this calculation is based on implied volatility of 92% with three trading sessions remaining.
The weekly contract is the purest play on Ambarella earnings. Even during quiet conditions like Tuesday’s session, these premiums reflect what traders collectively expect from Ambarella stock in the immediate aftermath of its quarterly announcement and worth our consideration.
The implied dollar move, up or down, works out to about 8.3% in AMBA shares by Friday’s close. The pricing estimate is mostly in the ballpark as it relates to recent reactions and suggests another decent-size, if not normal, move in Ambarella stock could be on the way.
Investment accounts under Christopher Tyler’s management do not currently own positions in any of the securities or their derivatives mentioned in this article. The information offered is based upon Christopher Tyler’s observations and strictly intended for educational purposes only; the use of which is the responsibility of the individual. For additional market insights and related musings, follow Chris on Twitter @Options_CAT.