With weakness continuing to hound the Nasdaq Composite, bears seeking honey should turn an eye toward the technology sector. It’s chalk full of toppy stocks and deteriorating price charts. Distribution days and failed rallies are becoming all too commonplace. And support breaks litter the sector like fireworks in the night sky on the Fourth of July. Among the most vulnerable stocks heading into the shortened holiday week is Ambaraella Inc (NASDAQ:AMBA). Indeed, the depths are beckoning to AMBA, and it seems all too anxious to respond.
 Ambarella is a semiconductor company based in Santa Clara, California that went public in 2012. The stock rallied right out of the gate but really began to heat up in 2014 when it kicked off its historic ascent to $129.19.
AMBA stock lovers were quickly reminded that the volatility knife slices in both directions. When the worm finally turned, Ambarella cratered back to $35 and has traded in a volatile range ever since.
In sizing up a price chart, I have a process I tend to follow for consistency … a method to the madness, if you will. First is trend and momentum. Second is support and resistance. And third is volume. Let’s take a look at all three using AMBA’s weekly and daily charts.
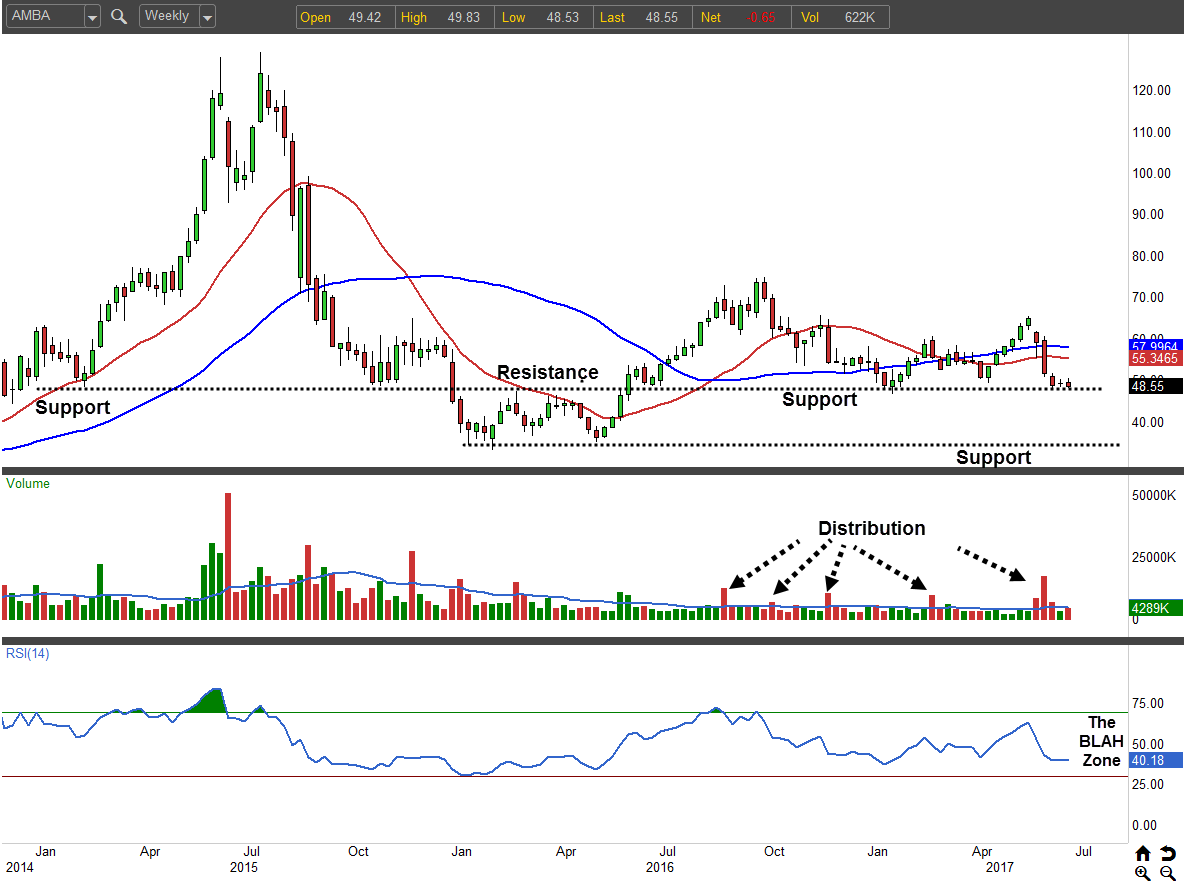
AMBA Stock: Weekly Stock Chart
We begin with the weekly simply because it puts the day-to-day machinations in context. Before analyzing the trees, it’s important first to appreciate the scope and size of the forest. The weekly trend for AMBA is essentially flat. So says the moving averages which have been crisscrossing in noncommittal fashion. But, since we are currently beneath both the 20-week and 50-week moving averages, the bears arguably hold the upper hand as far as the trend is concerned.
As for momentum, well, there isn’t much. The RSI Indicator has been ping-ponging between 39 and 60 since last October, which is about as neutral a range as you’ll see.
Click to Enlarge
The final piece is support and resistance. Given its recent descent, Ambarella stock is testing the lower end of its range near $48.
History shows there is quite a bit of memory in this area. In 2015 it acted as support, in 2016, it acted as resistance and this year, it is once again acting as support. If sellers can take out this floor, then shareholders better watch out below. The next support isn’t until $35, so we could see some swift follow through.
On the volume front, sellers have held absolute control for months now. I count seven distribution weeks over the past year compared to just one week of accumulation. And much of the selling pressure has materialized recently. So the message from volume is clear — institutions are liquidating.
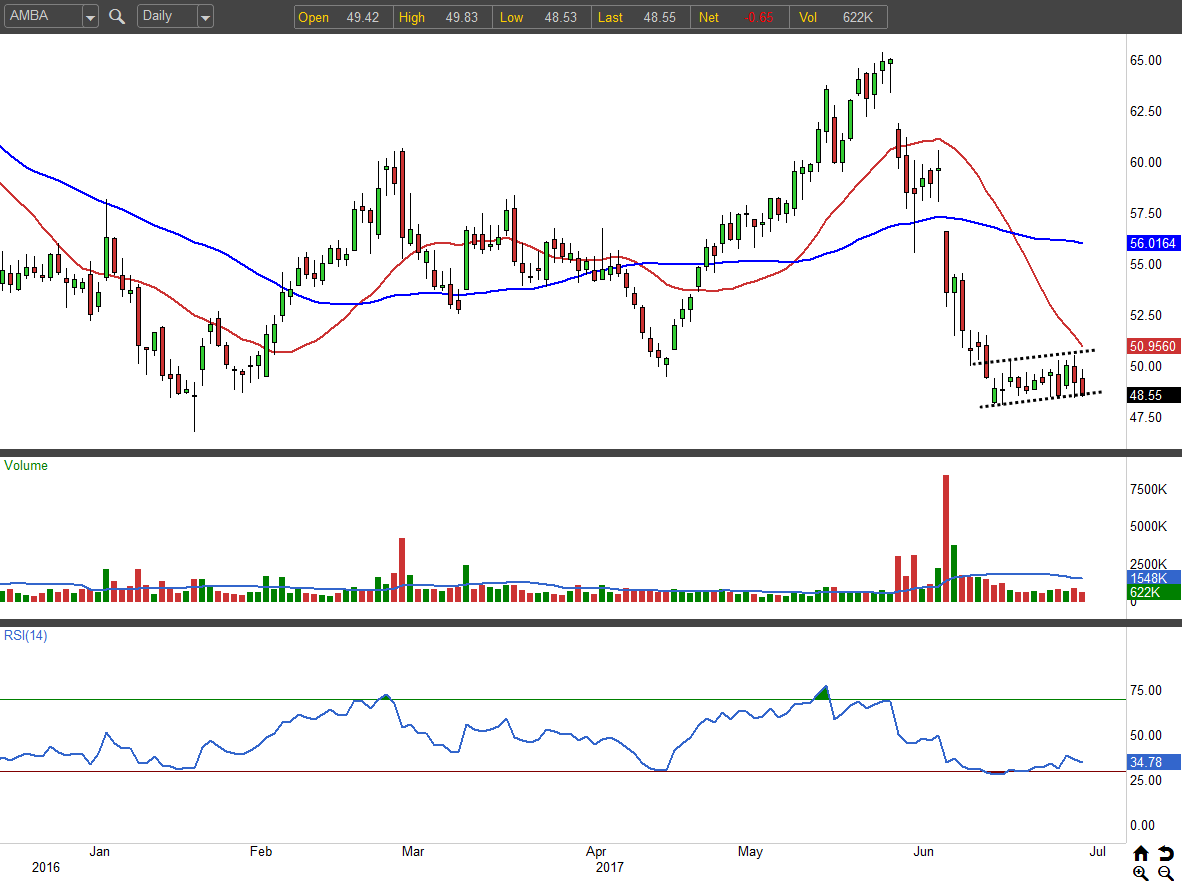
AMBA Stock: Daily Chart
AMBA’s reversal of fortune is clear to see on the daily chart. Fueled in large part by a disappointing earnings announcement, Ambarella has shed some 25% of its value over the past month. With it now submerged beneath all major moving averages, any and all rallies are suspect.
It’s particularly telling that the stock hasn’t been able to get off the mat, despite being drastically oversold. When a stock drops 25% and then can only muster the strength to drift sideways for two weeks, well, that’s saying something. It’s weak sauce as the kids say these days.
Click to Enlarge
With the two-day drop to enter the weekend, AMBA is now testing the lower end of its low base pattern. She’s one banana peel away from a breakdown.
The AMBA Trade
If we see a break of last week’s low (around $48.30), then buy the Aug $47.50 puts for around $2.35. The risk is limited to the initial debit and will be lost if the stock sits above $47.50 at expiration. The potential reward is limited only by the stock falling to zero, so root for pain to visit Ambarella following the support break.
At the time of this writing, Tyler Craig held no positions in any of the aforementioned securities.