Shares of Netflix (NASDAQ:NFLX) haven’t been too hot lately. Shares fell another 1.5% on Friday, ending the week with losses of 8.4%. While NFLX stock continues to sink, the broader market continues to hover near its highs.
Do the charts suggest a turnaround could be in store? The weekly losses are a lot compared to the steady nature of the PowerShares Nasdaq ETF (NASDAQ:QQQ) and other high-profile names.
Since reporting earnings in July, Netflix is down about 25%. However, let’s not forget this name is still up 65% in 2018. While the recent action has been quite bearish, investors are wondering if that trend is poised to continue or if a turnaround is in store.
What do these two charts say? Let’s start with the longer term outlook.
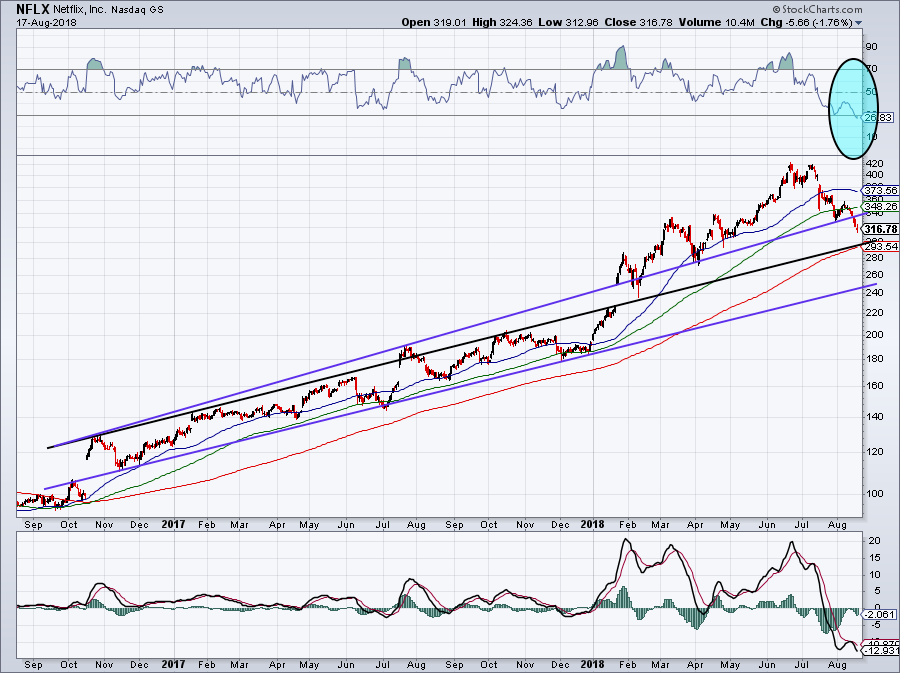
Two-Year Look at NFLX Stock
Click to Enlarge
Right off the bat, we can see that NFLX stock is the most oversold it’s been in two years. We can tell that thanks to the RSI (blue circle). But that alone does not mean a bounce is coming. Oversold stocks can become more oversold, just like overbought stocks can become more overbought.
Shares are now below two big moving averages, the 50-day and 100-day. Now at $316, it seems like a date with its 200-day moving average (now at $294) could be in the cards.
If we use the purple trend lines, we can see that support failed earlier this month. The bottom of that purple channel support doesn’t come into play until $250. However, if we use the black uptrend for Netflix, support sits near $300.
Should NFLX stock decline to this level, trend support and its 200-day (which it hasn’t touched since
2016), a bounce should commence. Even if it doesn’t mark the bottom, it should at least give bulls some reprieve.
It would be wise for shorts to book some profit in this zone.
Year-to-Date Look at NFLX Stock

Click to Enlarge
That’s the long-term outlook, but what does NFLX stock chart say about the short term?
2018 uptrend support (purple line) has failed and a subsequent retest of this level acted as resistance. That’s not good for bulls. Support level No. 1 failed as support and No. 2 comes into play at $300.
Like we said with the two-year chart, this level should at least be good for a bounce. Support level No. 3 doesn’t come into play until $250. Also like the two-year chart, this was the bottom of Netflix’s previous uptrend channel. So these two levels really stand out to me.
In addition to that, a drop to $250 would test the January gap-up that sparked this year’s big move. To fill that gap, NFLX stock would need to decline to about $228, a near-30% decline from current levels. Short of a big market correction, I don’t expect that.
One note for Fibonacci traders. Using the 2018 range, the 50% retracement level sits near $309 while the all-important 61.8% sits at $282. If Fib traders go from the January gap-up to the recent $420 high, the 61.8% sits at $315. Losing this level would tell me NFLX stock is likely heading to the 200-day.
What About the Upside?
So what’s this potential 23% rally all about? That would take NFLX stock to $390, the average analyst price target over the last 90 days. To get there, first support No. 2 and $300 needs to hold should Netflix fall that far. Second, NFLX stock needs to push through its 20-day moving average and current downtrend resistance (blue line on the second chart).
Shares will also need to get back above the 100-day and 50-day moving averages. From there, NFLX stock will need to retest prior uptrend support (purple line on the second chart). That retest may come near $390 and offer short-term bulls a profit-taking opportunity.
That’s a lot of technical detail to absorb, but the bottom line is pretty simple: wait for a retest of $300 or a break above short-term resistance before investing in NFLX stock.
Bret Kenwell is the manager and author of Future Blue Chips and is on Twitter @BretKenwell. As of this writing, Bret Kenwell did not hold a position in any of the aforementioned securities.