The S&P is back in record territory… are all the risks gone?… what one valuation metric says about forward returns… how to remain in the market despite valuation risk… next week’s event with TradeSmith CEO Keith Kaplan
As I write on Thursday, the S&P 500 is building on yesterday’s new all-time high.
If you held through the Iran-related correction – and perhaps even took advantage of lower prices by adding to high-conviction holdings – congratulations!
But while the S&P has finally returned to its January high, and now pushed above it, consider what’s changed since January:
- We remain in a war with Iran that has already triggered a 10%+ market drawdown.
- Peace talks have failed once, and though they’re restarted, the market has priced in a permanent ceasefire that doesn’t yet exist.
- Oil remains at levels far above where it traded at the start of the year, with Goldman Sachs warning that a severe supply shock could drag the S&P 500 as low as 5,400.
- Headline CPI inflation reached a two-year high of 3.3% in March, largely fueled by a record 21% monthly spike in gasoline.
- Traders have pushed rate-cut expectations all the way to mid-2027, a massive shift from the easing cycle we expected in January.
Does our new all-time high really price in all these risks?
Maybe. But even that may not be the most important question, because even if so, there’s a critical follow-up…
What kind of returns can investors realistically expect from here, given today’s lofty prices?
The quieter yet more dangerous risk: how much you’re paying
Beyond writing the Digest, I also helm InvestorPlace’s Investing Insider newsletter.
Every Friday, I feature interviews with our expert analysts, profile the research of major Wall Street investment shops, highlight the most lucrative investment trends in the market, and look squarely at the risks and opportunities within the market.
In last week’s issue, we highlighted one such key risk – valuation.
We looked at one of the most reliable long-term valuation measures we have: the cyclically adjusted price-to-earnings (CAPE) ratio, also called the Shiller P/E ratio. Developed by Nobel laureate Robert J. Shiller, it compares stock prices to 10 years of inflation-adjusted earnings.
The core message of the CAPE is simple:
- High starting prices → lower future returns.
- Low starting prices → higher future returns.
So, where are we today?
At almost 41.
As you can see below, that’s the second-highest reading in more than 140 years of market history, surpassed only by the peak of the dot-com bubble.
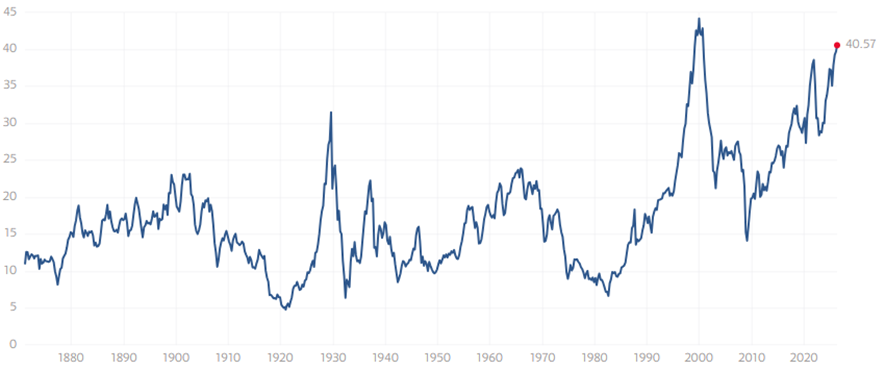
Source: Multpl.com
So, why is this a big deal?
Let me show you.
Below, we look at a chart that plots every starting CAPE ratio since 1871 against the annualized real return investors earned over the subsequent 10 years.
The pattern is difficult to ignore: At starting CAPE ratios above 35, forward 10-year returns have clustered mostly between 0% and 5% annually, with several periods producing negative real returns.
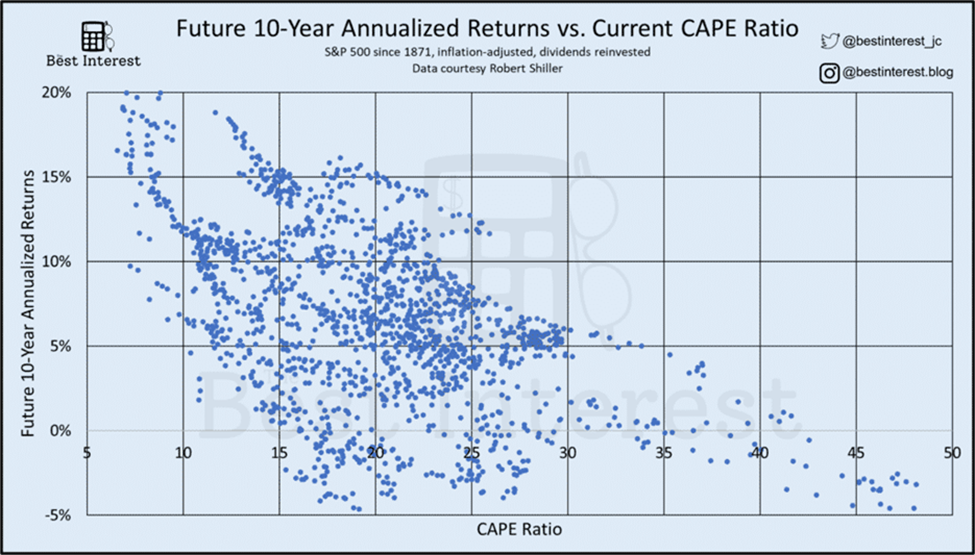
Source: Robert J. Shiller (data) / Best Interest
A 2024 academic working paper from researchers at La Trobe, Massey, and Auckland University of Technology called “Estimating Long-Term Expected Returns” revisits how well valuation predicts long-term returns.
Using an improved version of the CAPE ratio, they find that starting valuations explain a meaningful portion of 10-year return outcomes – reinforcing what the historical data already suggests.
The relationship isn’t perfect. It’s not a crystal ball. But over long periods of market history, it’s been one of the most consistent signals we have.
But what about “this time is different”?
Every time valuation measures (like the CAPE ratio) flash a warning, a familiar counterargument emerges:
- Interest rates are structurally lower now than in past years…supporting higher valuations.
- Technology companies have higher margins…supporting higher valuations.
- The old averages don’t apply anymore…supporting higher valuations.
The investment shop Research Affiliates has examined every one of these arguments in detail. Their conclusion: Some of them have merit – there are legitimate reasons to believe the equilibrium level of valuations is modestly higher today than the 20th-century average.
None of them, however, explains a CAPE of 40.
And they make one point that cuts through all the debate: Even if today’s elevated valuations never revert to the mean – even if they’re here to stay – that still implies low future returns.
Bottom line: When you pay a high price for future cash flows, the math of what you’ll earn going forward is simply lower.
To be clear, today’s elevated CAPE isn’t a timing signal
CAPE told us the market was expensive in 2018. Investors who acted on that signal missed a significant bull run. This is a long-game lens, not a “Sell” button.
But investors must be aware of this as we return to new all-time highs and FOMO ramps back up.
Of course this leaves us with an uncomfortable dilemma…
On one hand, today’s momentum is decidedly bullish, and stepping aside has consistently proven costly over the past several years.
On the other hand, starting valuations matter. And we just saw that today’s valuation suggests underwhelming 10-year returns at best.
So, what’s the answer?
Well, what if there’s a way to remain in today’s bullish, record-setting market without accepting its long-term valuation risk?
Well, there is – and right now, you can explore it for yourself. (I include links below where you can take a look.)
You see, our corporate affiliate TradeSmith has been developing a system designed to scan thousands of stocks each day, looking for specific setups that have historically led to high-probability trades…and they’ve opened up access so you can test it out ahead of an event they’re holding next week.
But let’s back up and fill in a few details…
Track specific stock signals – not bullish momentum or valuation fears
Today’s market environment calls for a different approach – one that doesn’t rely on long-term forecasts or broad market assumptions, but, instead, focuses on specific opportunities as they emerge.
TradeSmith has spent years building tools around that idea.
If you’re not familiar, TradeSmith is one of the world’s leading quantitative research firms. It has spent more than two decades developing data-driven tools for individual investors rooted in a simple idea…
Take the kind of analytical frameworks used by hedge funds and make them accessible in a practical way to everyday investors.
Their latest project takes that idea to the next level.
It’s not based on forecasts or narratives, but on patterns that have shown up repeatedly in the data. The TradeSmith engineers call these patterns “signals.”
Here’s CEO Keith Kaplan with more:
Our new AI-powered system doesn’t look at balance sheets… read earnings reports… or follow news headlines.
Instead, it detects tiny anomalies in stocks’ historical data.
Then it finds statistical connections between them that a human analyst would never find.
The basic idea is that every stock has its own behavior – its own tendencies under certain conditions. When those same conditions line up again, similar outcomes tend to follow. And the system is designed to identify those moments so investors can take advantage.
One example Keith provided came from Palantir Technologies Inc. (PLTR):
Our system signaled a 5.8% move in nine days, again with a historical accuracy rate of 95%.
The result was a 15.1% gain in seven days – nearly three times the forecasted return.
Another example comes from Lam Research Corp. (LRCX). Two factors had to align for this signal to fire. The stock had to close above its 200-day moving average. And that close had to fall two trading days before a market holiday.
Here’s Keith with the outcome:
When the signal fired on August 28, 2025 — two trading days before Labor Day — LRCX gained 11.4% in 15 days.
Now, not every signal will produce that kind of result. But it illustrates the underlying concept…
Instead of trying to predict the market, the system looks for moments when the odds are already tilted in your favor.
Back to Keith:
No one knows exactly why each signal works so well. Frankly, it doesn’t matter. Our AI finds the what… not the why.
It runs each stock through 847 individual calculations daily, compiling more than 2 million trade evaluations every 24 hours.
It’s looking for combinations that have worked before – regardless of whether there’s an obvious reason why.
The result is a trading system that doesn’t care if we’re in a bull or a bear market.
Keith will be walking through this system in more detail during his AI Signals Trading Event next Wednesday, April 22, at 10 a.m. Eastern.
He’ll explain how these signals are generated, what the system is currently flagging, and how investors can begin using this kind of approach in their own process.
He’s also giving us access to a working version of the platform ahead of the event – so you can test it out for yourself in real time. Search stocks, see active signals, and explore how it works.
Wrapping up
We’re back at all-time highs – even as risks accumulate and valuations remain stretched.
That doesn’t mean you should step aside. But it does mean you should be thoughtful about how you participate.
Have a good evening,
Jeff Remsburg