
While the rest of the stock market has been benefiting from a strong rebound from last month’s lows, Meet Group (NASDAQ:MEET) stock has been absolutely exploding. MEET stock is up about 75% since its rally started just two weeks ago.
Have investors missed the boat on MEET? Probably.
Meet Group is a U.S. company that “engages in the provision of mobile social entertainment apps designed for human connections. Its primary apps include MeetMe, LOOVOO, Skout, and Tagged.”
Since Meet Group stock has a market cap of just $440 million, the company is a long ways off from being called a technology juggernaut. After all, it’s not Netflix (NASDAQ:NFLX) or Microsoft (NASDAQ:MSFT).
Clearly though, MEET stock can still produce big-time profits for investors. On Jan. 8, MEET poured fuel on the fire of Meet Group stock’s run when it announced preliminary quarterly results that came in ahead of analysts’ consensus expectations. Since then, Meet Group stock has jumped 15%.
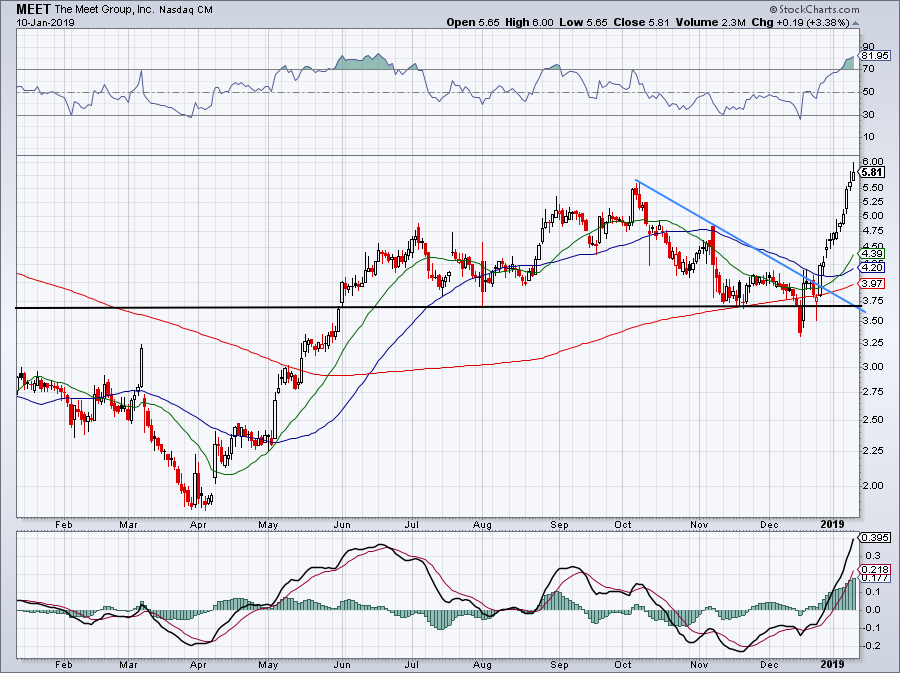
Click to Enlarge
The first chart above shows the daily performance of MEET for the last year. We can see that since June, $3.75 has been solid support for Meet Group stock. After a tough stretch in December, we can also see that MEET broke out, exceeding its downtrend resistance (depicted by the blue line) after it rose above all three of its major moving averages. It’s now pretty overbought, with an RSI over 80.
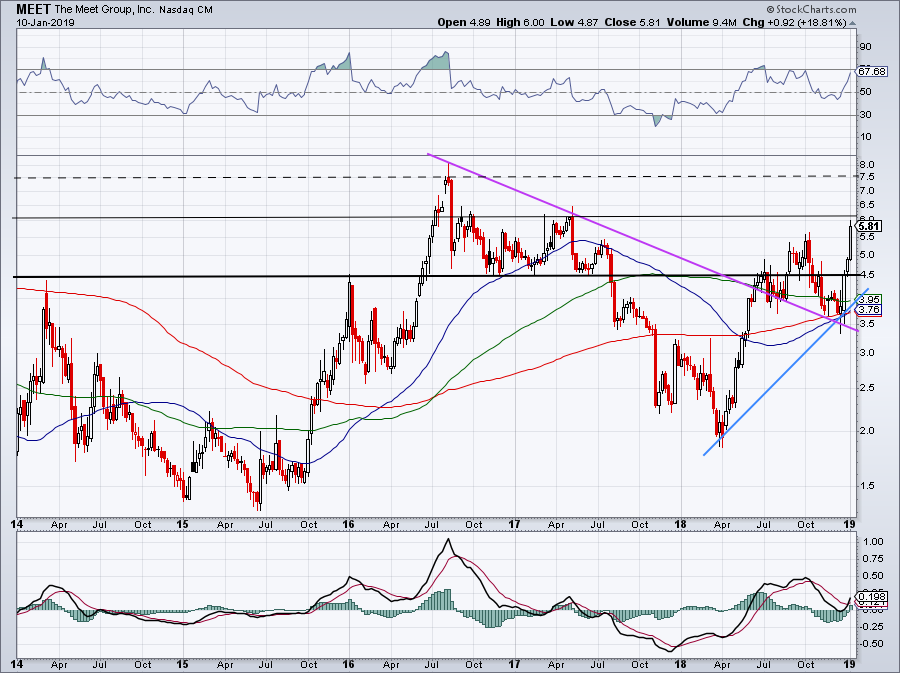
Click to Enlarge
There are a lot of important notes on this chart, but let’s start with MEET’s move above its downtrend resistance (depicted by the purple line) in mid-2018. After the stock eclipsed this level, it moved lower in tandem with it, but it continuously acted as support for MEET stock. The shares then erupted higher and ripped through the $4.50 level.
As we can see on the weekly chart, $4.50 has been a notable level. If and when Meet Group stock pulls back, I would look to see if this level becomes support and hold.s If it does, MEET’s risk/reward ratio will be excellent.
MEET has climbed 11 sessions in a row and has closed higher for four straight weeks. This week’s highs are the first target, and between $6.25 and $6.50 would be my next upside target. Looking a little longer-term, the $7.50 mark could be used as a target if Meet Group stock really takes off.
On the downside, see if $4.50 (depicted by the blue line on the weekly chart) initially acts as support or uptrend support.
The Bottom Line on MEET Stock
Despite the strong move of Meet Group stock and the company’s better-than-expected preliminary results, I will take a pass on Meet Group stock. Its business appears to be doing well, but it’s too risky for me to buy this name here and now after such a magnificent run. If, however, MEET drops and its support holds, then I’d consider going long MEET.
Bret Kenwell is the manager and author of Future Blue Chips and is on Twitter @BretKenwell. As of this writing, Bret Kenwell did not hold a position in any of the aforementioned securities.