
There’s a cautious yet optimistic tone on Wall Street, as indices continue to bounce from last week’s huge rally on Friday. Investors are hopeful that the market can continue higher, making up some of the monstrous losses from the fourth quarter. Let’s take a look at a few must-see stock charts for Tuesday.
Roku (ROKU)
Click to Enlarge
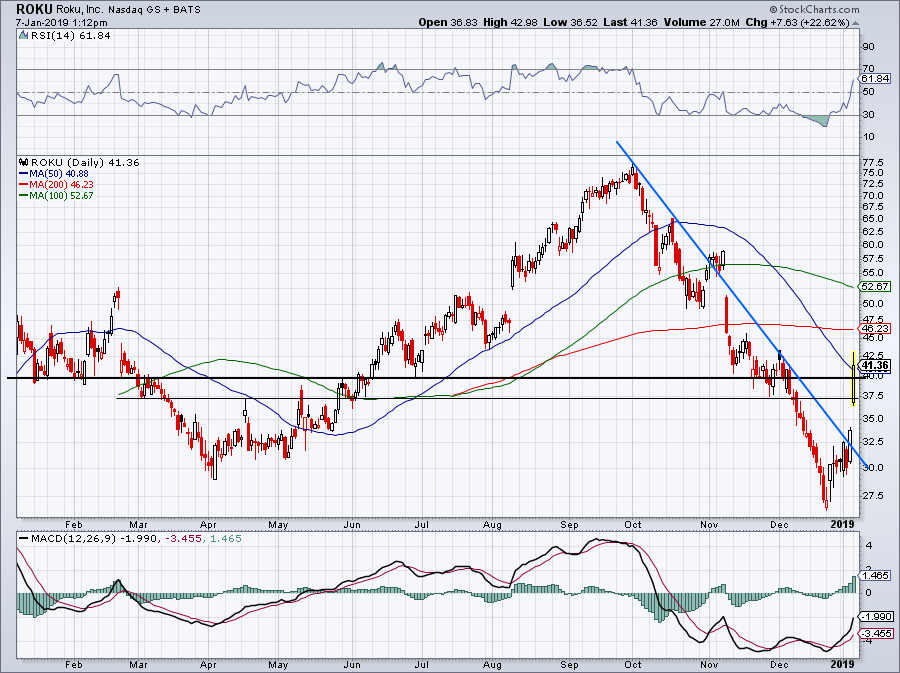
We’ve loved the fundamental story behind Roku for a while now. However, we were clear to label Roku as a broken stock and not a broken company. What now?
For now, Roku is having trouble pushing through the 50-day moving average with authority. Should it act as resistance — ROKU is up more than 20% after all — look to see if it can stay above $40.
That’s a tough ask given this rally and what type of volatility may lie ahead, but at the very least, over $37.50 should keep long-term bulls content that more upside is likely.
Eli Lilly (LLY)
Click to Enlarge
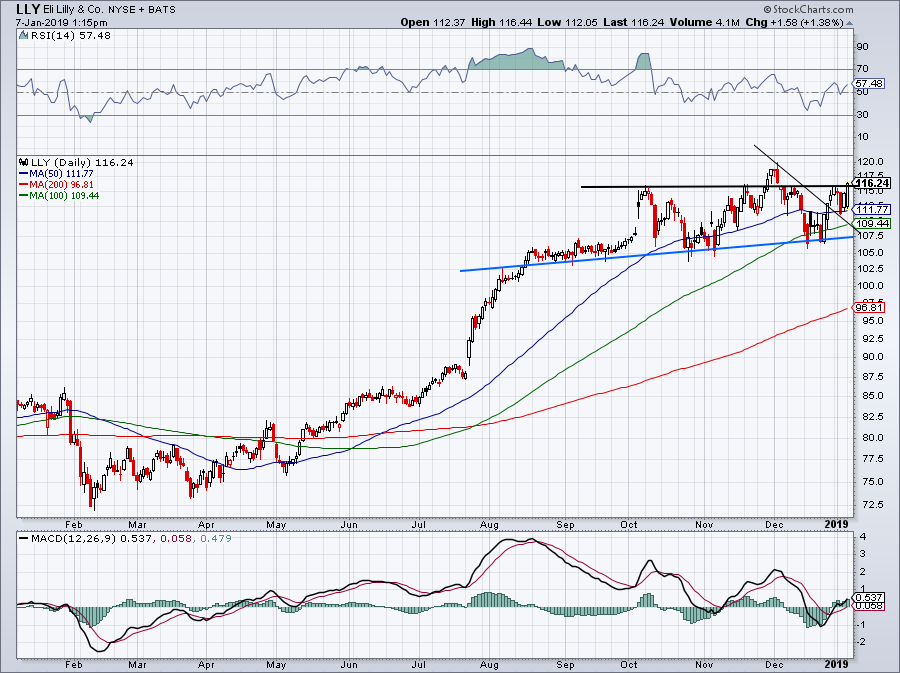
While LLY was down slightly at first, it’s now up about 1% Monday. More importantly though, it’s pushing the stock through the $115 to $116 area, which has been resistance for about three months now.
If it can close above this mark, the highs near $120 are on the table. Truth be told, so long as LLY stays over uptrend support (blue line), it still looks pretty good on the long side. At this point though, low-risk bulls will want to contemplate stopping out below the 50-day moving average.
Twilio (TWLO)
Click to Enlarge
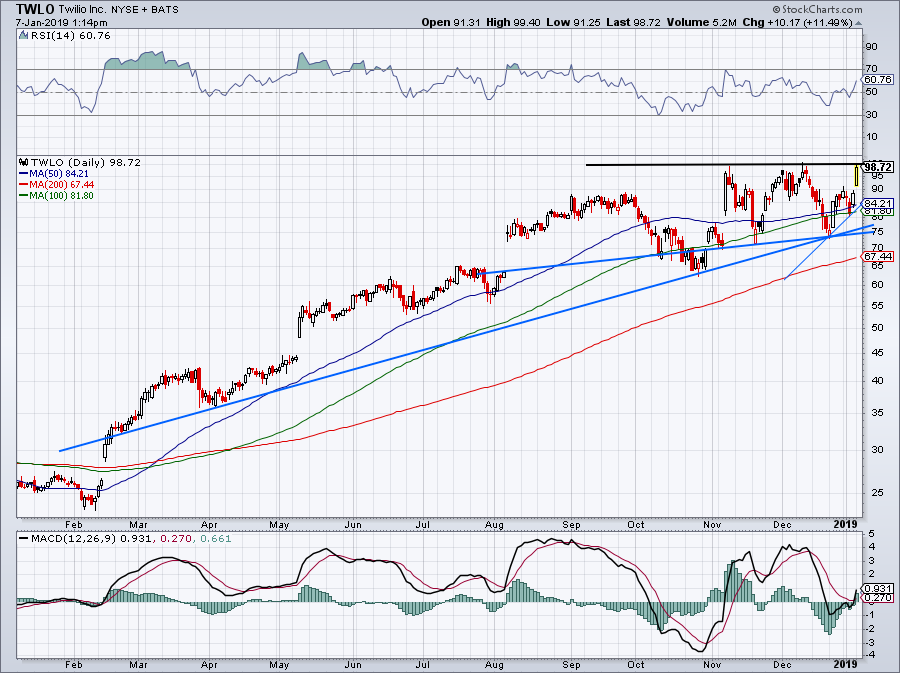
Twilio (NYSE:TWLO) is again bumping its head up against $100 per share, flirting with new all-time highs despite the overall markets still being quite some ways away from their highs.
There are various uptrend support levels below, as well as the 50-day and 100-day moving averages in the low- to mid-$80s. Not that TWLO is where I’d hide out amid escalating volatility, but so long as the markets don’t plunge, this one should be fine.
I’m looking for a breakout over $100 and am a buyer into support.
Nvidia (NVDA)
Click to Enlarge
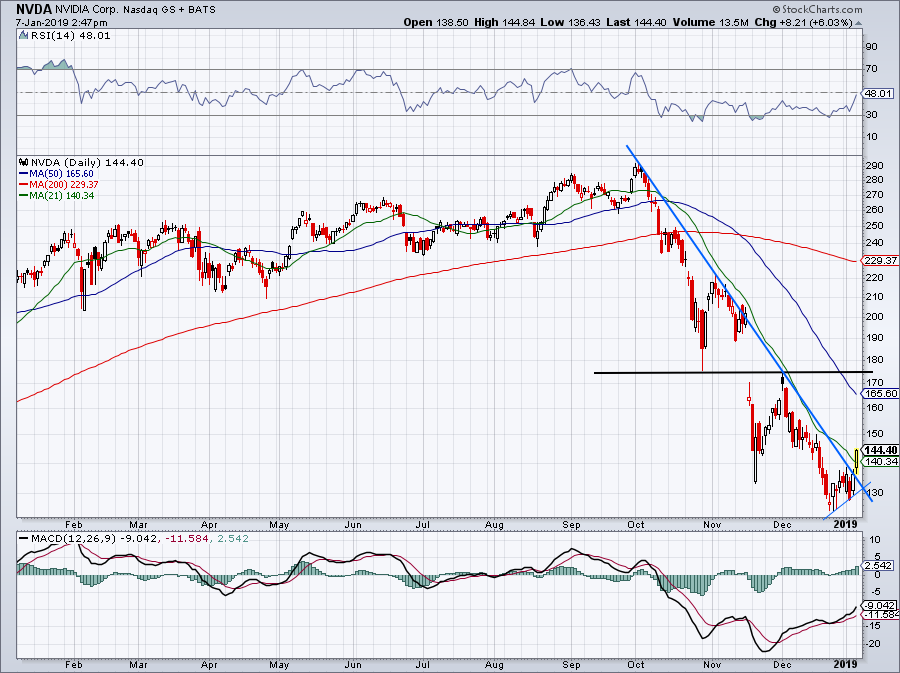
The move we’re seeing on Monday is encouraging, with Nvidia stock jumping over downtrend resistance (blue line) and pushing through the 21-day moving average. It’s the stock’s first session above this moving average since knifing below it in early October.
It’s been a painful, painful quarter for Nvidia, with shares falling more than 50% in less than three months. Even now, shares are still down more than 50% from its highs. As a result, some say it’s too cheap to ignore.
If Nvidia starts to rebound, look to see if it can get up to its 50-day moving average. Given how tough it was for Nvidia to get through the 21-day, I expect the 50-day to give it trouble. If by chance it does not, $175 should hold the name in check. At this point, bulls mostly want to see NVDA stay above $130. If not, a drop down to $120 is likely in the cards.
S&P 500 ETF (SPY)
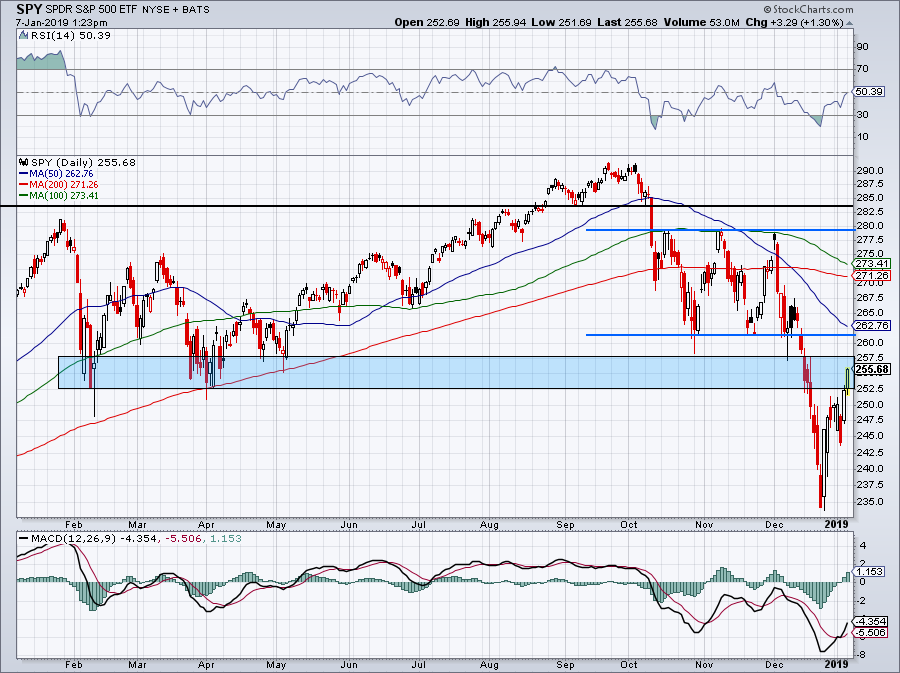
Click to Enlarge
Had the jobs report not come in so hot and had the Fed not backed off its hawkish stance, this support area would have likely acted as resistance. Note that we’re not out of the woods yet, though.
I would feel better about the SPY rallying through $257.50 and hitting resistance between $260 and the 50-day moving average. Should it do so, we need to see this $5 range — between $252.50 and $257.50 — hold up as support. If it does, bulls could regain some momentum.
Bret Kenwell is the manager and author of Future Blue Chips and is on Twitter @BretKenwell. As of this writing, Bret Kenwell is long CELG, ROKU and NVDA.