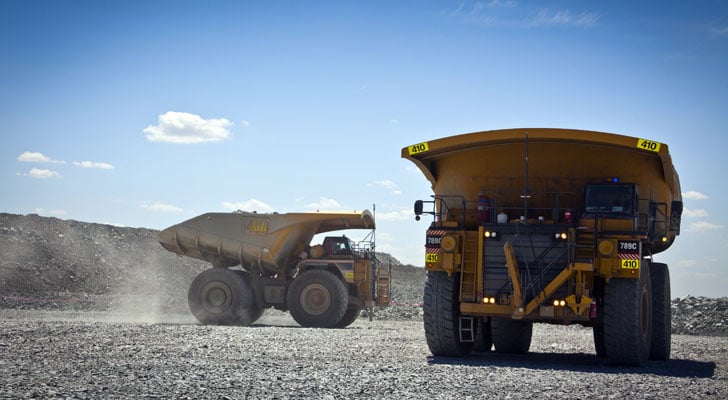
The price of gold has advanced nicely since the lows in the summer of 2018. Along with this, gold-related stocks like Barrick Gold (NYSE:ABX) have also appreciated in price and increasingly look like they want to break out higher in 2019. ABX stock has been coiling below a key technical resistance level for the past few months, and active traders and investors would be wise to put this stock on the watch list.
When the stock market encounters rough patches, investors often quickly begin talking about allocating capital to “risk-off” assets such as gold. While gold can perform well when the broader stock market slumps, it all depends on what the underpinnings of the stock market weakness are all about. The most recent stock market slump, in my eye, is more structural and thus likely longer lasting than any of the pullbacks we have seen over the past eight years or so — which is to say that the price of gold now has a better chance of appreciating both in absolute as well as in relative terms versus stocks.
ABX Stock Charts
Click to Enlarge
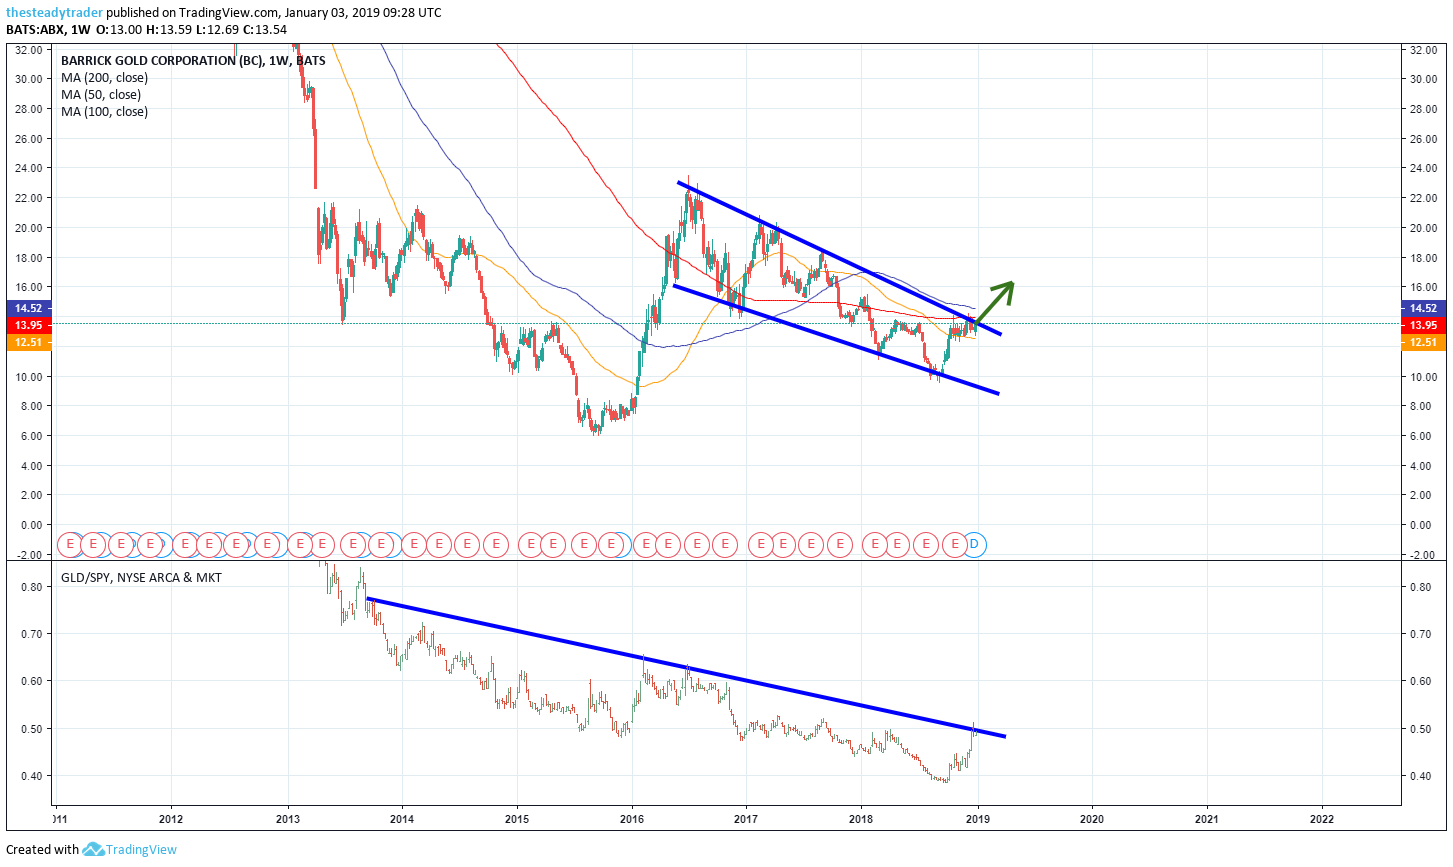
Moving averages legend: red – 200 week, blue – 100 week, yellow – 50 week
Moving on to the charts, we start off with a multiyear look at ABX stock. Here we see that after a rally attempt in 2016, the stock quickly began to stall and by August 2018 had retraced much of that rally. The retracement, however, also took place in a well-defined and down-sloping wedge formation as I marked with the blue parallels. The rally in the stock since September now has it back at the upper end of this range.
More importantly, however, the recent rally in the stock was much in line with what the price of gold did. At the bottom of the chart I plotted a ratio chart of the price of gold divided by stocks. This shows that not only did gold rally in absolute terms in recent months but also in relative terms. In fact, gold is now close to breaking past a diagonal line of resistance (blue line) on the relative chart as well.
Click to Enlarge
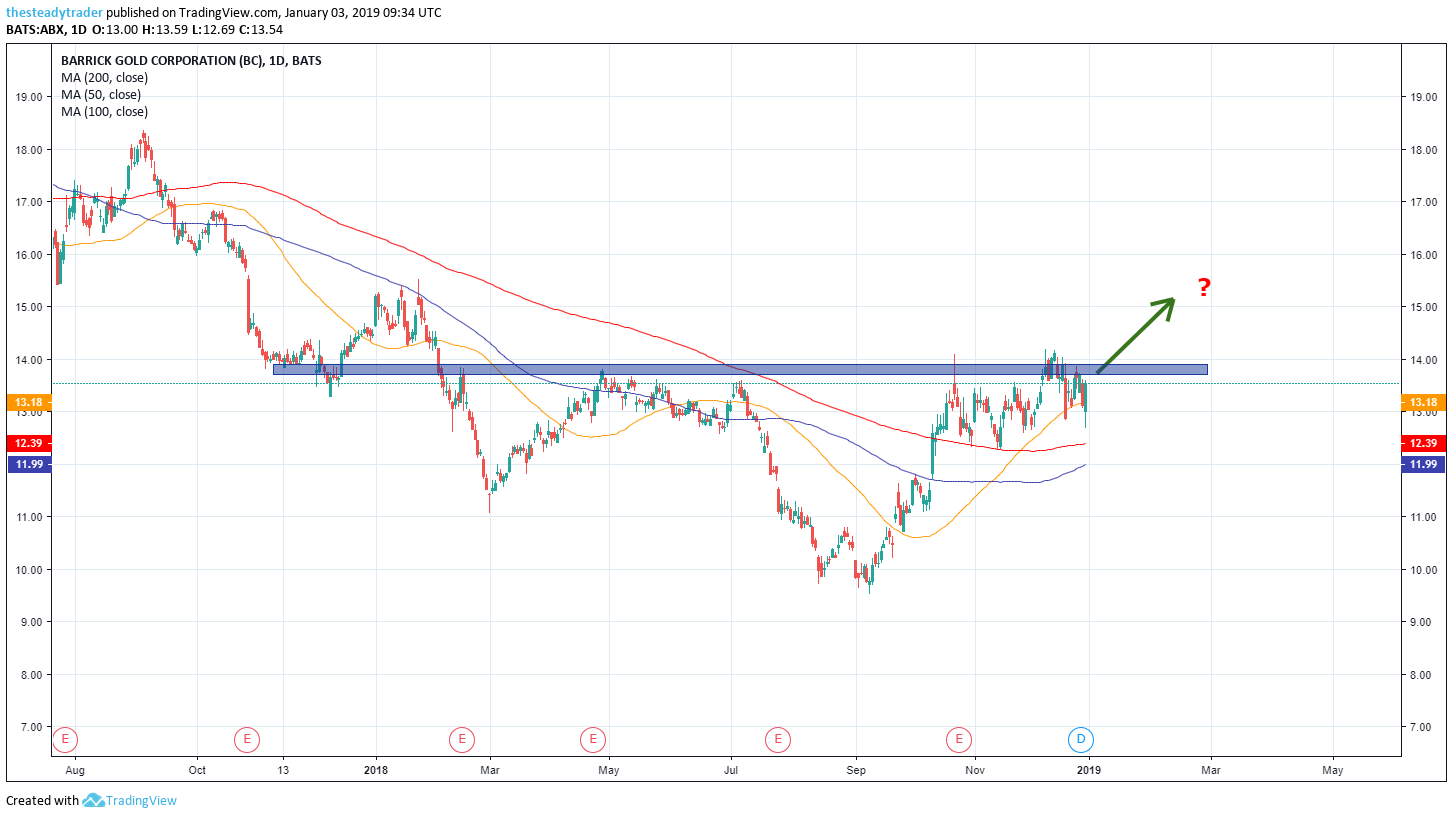
Moving averages legend: red – 200 day, blue – 100 day, yellow – 50 day
On the daily chart, we see that after a good-sized rally in September, ABX stock ran out of steam in October and has trotted sideways ever since. The technical area of resistance around the $14 area is well defined and the longer the stock can coil below there without any technical deterioration the better it’s odds are of a sharp rally above there.
The trade setup is straightforward: Buy ABX stock upon a break and hold (on a daily closing basis) above the $14 area. Stop loss is $12 and a first upside profit target at $16.
Get FREE ACCESS to Serge’s renowned Stock Market Scanner with actionable trade ideas. Get it HERE.