
Shares of biotechnology stocks as represented by the popular iShares Nasdaq Biotechnology ETF (NASDAQ:IBB) have rallied close to 25% off their Dec. 24, 2018, lows. The charts in multiple time frames now suggest this move is overdone for the time being and that a mean-reversion trade to the downside is likely.
Biotechnology stocks and the IBB ETF are often used as a risk-on/risk off trading vehicle by traders, meaning that if they think the broader stock market may ascend they will buy the IBB ETF for some extra leverage. The 25% rally over the past three weeks in my eye can at least in part be attributed to this type of trader positioning.
Another reason for the sharp bounce was two acquisitions within this space over the past two weeks, which further got the bullish spirits going.
While those near-term catalysts likely surprised many bears, what has not changed despite the squeeze higher is how the IBB ETF looks on the bigger-picture charts.
IBB ETF Charts
Click to Enlarge
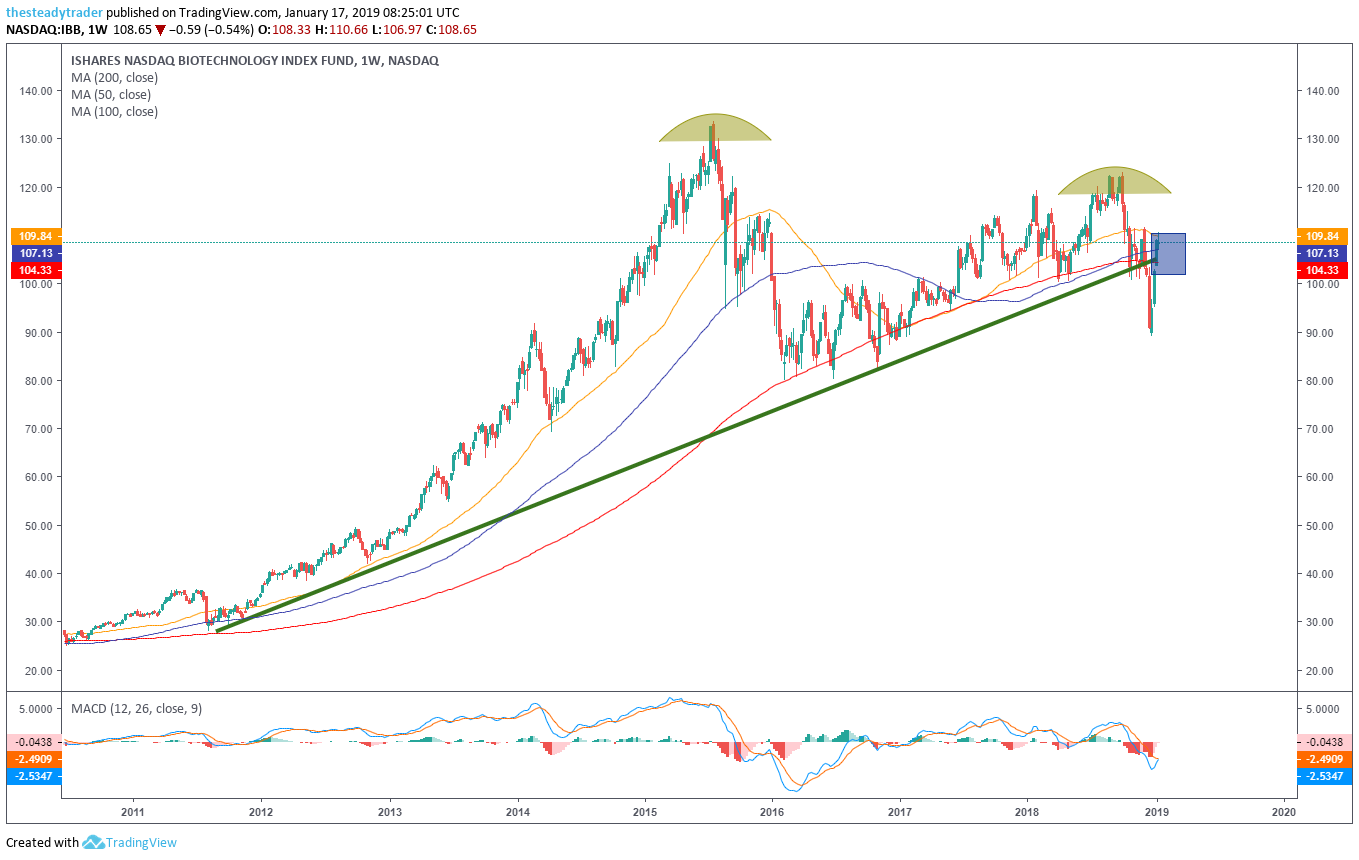
Moving averages legend: red – 200 week, blue – 100 week, yellow – 50 week
Zooming out on the multiyear weekly chart, we see that the IBB ETF made a clear overshooting top in 2015. After a sharp mean-reversion move lower into early 2016 these stocks found support at the green line and began to find footing again. By September/October of 2018, however, these large-capitalization biotech stocks made a notable lower high versus their 2015 highs as the broader U.S. stock market began to sell off.
As a result of the q4 weakness, the IBB ETF broke below its longer-standing technical support line (green line). At the same time, all of its intermediate term moving averages (50-, 100- and 200-week) are now sloping lower and will likely soon provide a tremendous amount of overhead resistance.

Click to Enlarge
Moving averages legend: red – 200 day, blue – 100 day, yellow – 50 day
On the daily chart, we see that the recent rally has pushed the IBB ETF right back up to its 100- and 200-day simple moving averages, which also coincides with simple diagonal resistance. The daily MACD momentum oscillator at the bottom of the chart is also getting near-term overbought.
On Wednesday, IBB attempted to break above this layer of technical resistance but was quickly rejected.
Active investors and traders could look to enter into a short position in the IBB ETF around the $109-$110 area. A next downside profit target is $102 and a stop loss at $112.
Get FREE ACCESS to Serge’s renowned Stock Market Scanner with actionable trade ideas. Get it HERE.