As the stock market began to lift off its late December 2018 lows and ultimately turned into a sharp rally by early January, shares of homebuilding and related stocks were not left behind. In fact, this group of stocks as represented by the SPDR S&P Homebuilders ETF (NYSEARCA:XHB) has outperformed the broader market rally, and the XHB ETF now sets up for a trade with a well defined next upside target.
Before digging into the charts and the specific near-term trade setup in the XHB ETF allow me to also note the following;
U.S. bond yields using the benchmark 10 year Treasury Note topped in October 2018 and to yours truly it looks like upside in yield terms is capped. If one believes that the U.S. consumer will not fall into a major recession in the next six to 12 months and bond yields remain capped across the yield curve but more importantly on the intermediate term to long end, then homebuilder and related stocks could be a good bet, at least in relative terms.
XHB ETF Charts
Click to Enlarge
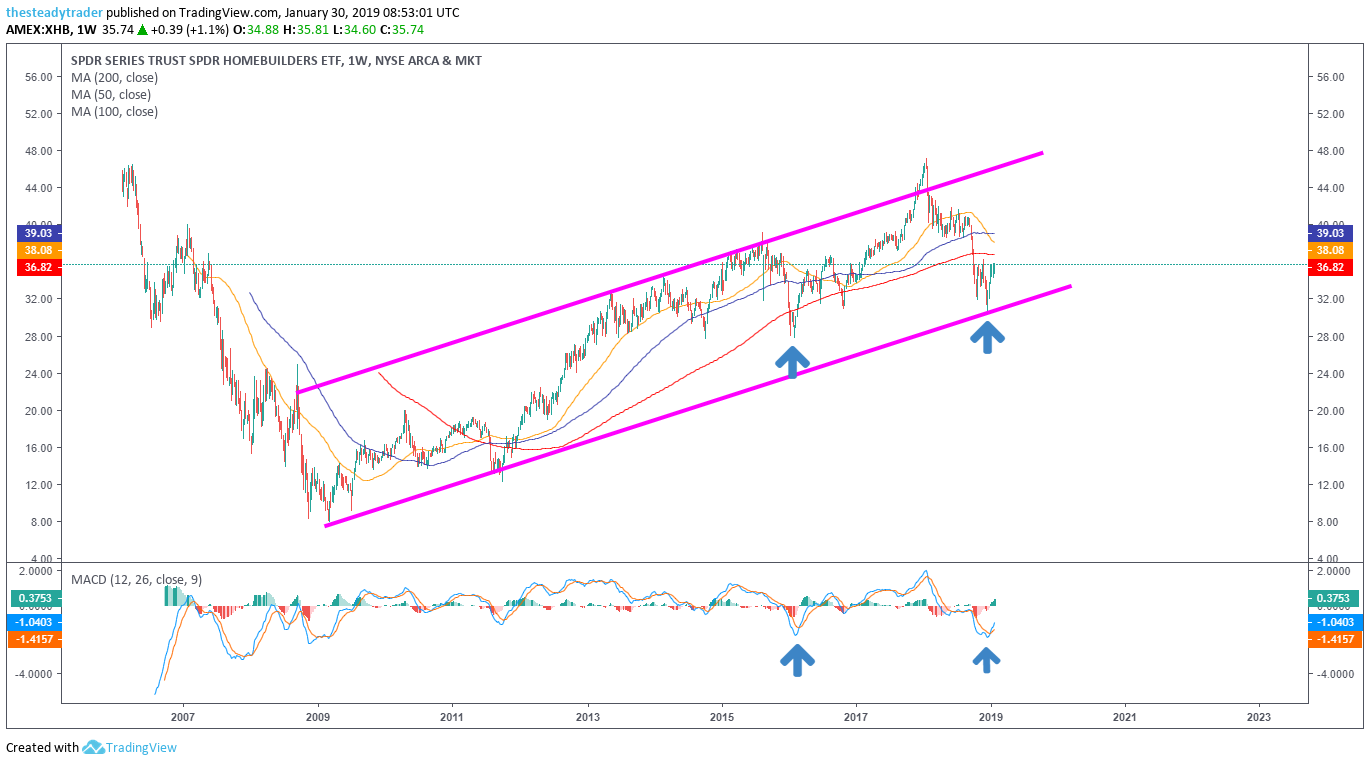
Moving averages legend: red – 200 week, blue – 100 week, yellow – 50 week
With that in mind, let’s look at the multiyear weekly chart of the XHB ETF and note that the late December 2018 lows coincided with the lower end of the long-standing up-trending channel. Also, from a momentum perspective, the weekly MACD oscillator at the bottom of the chart reached oversold levels that in the past led to bounces of several months.
While I think the upside momentum will likely slow for the XHB ETF, there still looks to be a well-defined next upside target to target for a trade.

Click to Enlarge
Moving averages legend: red – 200 day, blue – 100 day, yellow – 50 day
On the daily chart, we see that after an initial sharp bounce off the late December lows the XHB ETF has over the past few weeks (since early January) largely trotted sideways. This has allowed the blue 100-day simple moving average to catch up with price on the downside. This coiling of price right at this moving average and generally in a well-defined consolidation range does now increase the odds of a next leg higher.
Note that there are lots of earnings reports of constituent stocks in the XHB ETF still on tap in coming days and weeks. Nonetheless, the XHB could be bought here for a trade to a next upside profit target closer to $37, which would also roughly coincide with the red 200-day simple moving average. Any sharp one-day bearish reversal would be an initial stop-loss trigger.
Get FREE ACCESS to Serge’s renowned Stock Market Scanner with actionable trade ideas. Get it HERE.